Author Topic: Political Economics  (Read 804164 times)

DougMacG

  • Power User
  • ***
  • Posts: 18236
    • View Profile
Bill Clintonomics 1.0
« Reply #1650 on: August 08, 2016, 12:15:35 PM »
When did wages grow under Pres. Bill Clinton?  Only after passing pro-growth policies.
When will wages grow under Hillary Clinton if she wins and keeps her promises?  Never.

The facts of the Clinton economic growth record:  Bill Clinton's presidency gets credit for some impressive private sector growth but the lion's share of it came in the last 4 years after he co-opted the Republicans economic agenda.  See chart below.

Bill Clinton's economic policy achievements:
1) Passed NAFTA with majority Republican support, majority Democratic dissent.  Took effect 1994.
2) Passed Welfare Reform with majority Republican support, lacking majority Democratic dsupport, 1996.
3) Passed Capital Gains Tax Rate cuts  with majority Republican support, 1997.

Hillary Clinton -
 1) opposes free trade, 2) opposes welfare reform, and 3) wants to raise taxes further than Obama did on investment, and crush our fragile growth.  

Bill Clinton's economic results:
Venture capital grew 6 fold over 1995 levels in the years following the capital gains tax rate reductions.
Real wages, however, grew at 6.5 percent rate after the Bill Clinton-Newt Gingrich capital gains tax rate cuts compared with 0.8 percent growth rate after the Bill Clinton tax rate hikes of 1993.
http://www.heritage.org/research/reports/2008/03/tax-cuts-not-the-clinton-tax-hike-produced-the-1990s-boom

Hillary Clinton now opposes the pro growth policies that worked for Bill Clinton.

Bill Clinton -
Not satisfied with growing the private economy and balancing the federal government, returned to big government ways, attacked America's most successful company Microsoft in March 2000 with a DOJ lawsuit that triggered the tech stock crash of 2000 and the 2000-2001 recession.  Growth ended, see chart:

Chart source:  Washington Post
https://www.washingtonpost.com/news/wonk/wp/2012/09/05/the-clinton-economy-in-charts/

Hillary Clinton opposes all the policies that accelerated economic growth, favors all policies tied to big government growth, is running to continue Obama's slow growth, low growth polices.

Insanity or deception?  Candidate Hillary promises the results of the Bill Clinton administration while rejecting the policies responsible for that growth.
« Last Edit: August 08, 2016, 02:04:19 PM by Crafty_Dog »


Crafty_Dog

  • Administrator
  • Power User
  • *****
  • Posts: 69383
    • View Profile

DougMacG

  • Power User
  • ***
  • Posts: 18236
    • View Profile
Re: Robot run McDonald's in Phoenix
« Reply #1653 on: August 09, 2016, 08:56:10 AM »
http://www.capoliticalreview.com/capoliticalnewsandviews/new-mcdonalds-in-phoenix-run-entirely-by-robots/

Yes, as stated previously, minimum wage law does not legislate raises, it bans the hiring of people whose output is worth less than to employ.  It also gives the companies cover for accelerating their automation and job elimination plans that might have been coming anyway.

Does the robot get paid leave, union dues, free healthcare for relatives or any other labor mandate?

DougMacG

  • Power User
  • ***
  • Posts: 18236
    • View Profile
Re: Political Economics, Scandinavian Envy, Fantasy
« Reply #1654 on: August 17, 2016, 07:51:30 AM »
Denmark Isn't Magic
New research suggests that the American dream isn’t alive in Scandinavia

Despite liberal arguments that Denmark is so much better than the U.S. at social mobility, its poor kids are no more likely to go to college.
http://www.theatlantic.com/business/archive/2016/08/the-american-dream-isnt-alive-in-denmark/494141/

Danish-Americans have a measured living standard about 55 percent higher than the Danes in Denmark. Swedish-Americans have a living standard 53 percent higher than the Swedes, and Finnish-Americans have a living standard 59 percent higher than those back in Finland.
https://www.bloomberg.com/view/articles/2016-08-16/denmark-s-nice-yes-but-danes-live-better-in-u-s

this Danish Dream is a “Scandinavian Fantasy,” according to a new paper by Rasmus Landersø at the Rockwool Foundation Research Unit in Copenhagen and James J. Heckman at the University of Chicago. Low-income Danish kids are not much more likely to earn a middle-class wage than their American counterparts. What’s more, the children of non-college graduates in Denmark are about as unlikely to attend college as their American counterparts.
http://www.nber.org/papers/w22465
http://www.nber.org/papers/w22465.pdf

objectivist1

  • Power User
  • ***
  • Posts: 1048
    • View Profile
Janet Yellen Suggest Rate Hike Coming in September...
« Reply #1655 on: August 28, 2016, 11:19:09 AM »
Fed Officials Suggest Rate Hike On The Way In September

Friday, 26 August 2016   Brandon Smith

As predicted here at Alt-Market, despite all other indications of a receding economy the Fed is pushing for yet another rate hike in 2016.  This is a CLASSIC move for the Federal Reserve.  They almost ALWAYS hike rates into a recession/depression, and this usually accelerates the downturn.  Keep in mind the timing of these announcements; only two months before the U.S. presidential elections.  I believe the goal here by the elites is to initiate a soft downturn going into the elections which will boost Donald Trump's campaign.  I believe that they plan to place Trump into office and then allow the system to crash completely.  The point?  To place conservatives at the helm and then blame them for an economic collapse that was already engineered to happen by international financiers...


Federal Reserve Chair Janet Yellen said Friday that the case for an interest rate hike “has strengthened in recent months” in light of recent strong job growth, but she gave no signal that Fed policymakers will make a move at a meeting next month.

At the Fed’s annual symposium in Jackson Hole, Wyo., Yellen said the Fed’s policymaking committee “continues to anticipate that gradual increases in the federal funds rate will be appropriate over time” to meet the Fed’s goals for inflation and employment.

The Dow Jones industrial average rose after Yellen’s remarks, but logged a small decline at midday as the market digested the news that met its expectations. Meanwhile, Fed Vice Chairman Stanley Fischer said on CNBC that next Friday's report on August job gains could factor into the Fed's decision at its September 20-21 meeting, a remark that appeared to keep a rate increase on the table. The 10-year Treasury yield was up .03 percentage points in early afternoon trading at 1.6%.

The Fed raised its benchmark interest rate in December for the first time in nine years but has stood pat since then, leaving it at a historically low 0.4%.
"You have enemies?  Good.  That means that you have stood up for something, sometime in your life." - Winston Churchill.

DougMacG

  • Power User
  • ***
  • Posts: 18236
    • View Profile
Political Economics, Economic Growth under former Pres. Bill Clinton
« Reply #1656 on: August 29, 2016, 02:51:06 PM »
Wages grew 8 times faster with capital gains tax rate cut.  Wage and labor productivity growth requires increasing capital investment, not punishing it.  Who knew?


"Real wages grew at 6.5 percent rate after the Bill Clinton-Newt Gingrich capital gains tax rate cuts compared with 0.8 percent growth rate after the Bill Clinton tax rate hikes of 1993."

http://www.heritage.org/research/reports/2008/03/tax-cuts-not-the-clinton-tax-hike-produced-the-1990s-boom

The Heritage Foundation
March 4, 2008
Tax Cuts, Not the Clinton Tax Hike, Produced the 1990s Boom
By J.D. Foster, Ph.D.
Norman B. Ture Senior Fellow in the Economics of Fiscal Policy
Thomas A. Roe Institute for Economic Policy Studies

When pressed about the harmful effects on the economy, proponents of higher taxes often fall back on what can be called the "Clinton defense." President Bill Clinton pushed a major tax increase through Congress in 1993, and, so the story goes, the economy boomed. How, then, can tax increases be so bad for the economy? The inference is even stronger: that higher taxes actually strengthened the economy.

The Clinton defense is superficially plausible, but it fails under closer scrutiny. Economic growth was solid but hardly spectacular in the years immediately following the 1993 tax increase. The real economic boom occurred in the latter half of the decade, after the 1997 tax cut. Low taxes are still a key to a strong economy.

The Clinton Tax Defense

A growing body of literature and experience indicates that higher taxes are associated with a smaller economy.[1] It is generally axiomatic that the more one taxes something, the less there is of the item taxed.

There is surely no reluctance among proponents to argue that higher taxes on tobacco materially reduce tobacco consumption or that higher taxes on energy would appreciably reduce energy consumption. Yet, somehow, the argument persists that raisingtaxes on labor does not diminish the supply of labor or that raising taxes on capital does not appreciably reduce the amount of capital in the economy. In both cases, tax hikes weaken the economy and reduce the amount of income earned by American families.

The Clinton defense of higher taxes rests largely on a cursory review of the economic history of the 1990s. Whatever the theoretical debates, the proof, as they say, is in the pudding: President Clinton raisedtaxes, yet the economy grew, and grew smartly in the latter half of the 1990s. Economists have occasionally been accused of seeing something work in practice and then proving that it cannot work in theory. However, this is not the case here.

History suggests that the economy performed reasonably well in the years immediately following the tax hike, but history is not causality, and history sometimes needs a more careful examination to tell its story faithfully. Following the tax hike, the economy performed reasonably well, but not as well as one would expect given the conditions at the time. The real economic boom came later in the decade, just when the economy should have slowed as it made the transition from a period of recovery to normal expansion. Further, this acceleration coincided to a remarkable degree with the 1997 tax cut.

Contrasting the period immediately after the tax hike and the period immediately after the tax cut, the evidence strongly suggests that the tax hike likely slowed the economy as traditional theory suggests, and that it was the tax cut that gave the economy renewed vigor--and gave history the real 1990s boom. In other words, the Clinton defense of higher taxes does not hold up.

The Clinton Tax Hike

In 1993, President Clinton ushered through Congress a large package of tax increases, which included the following:[2]

An increase in the individual income tax rate to 36 percent and a 10 percent surcharge for the highest earners, thereby effectively creating a top rate of 39.6 percent.
Repeal of the income cap on Medicare taxes. This provision made the 2.9 percent Medicare payroll tax apply to all wage income. Like the Social Security payroll tax base today, the Medicare tax base was capped at a certain level of wage income prior to 1993.
A 4.3 cent per gallon increase in transportation fuel taxes.
An increase in the taxable portion of Social Security benefits.
A permanent extension of the phase-out of personal exemptions and the phase-down of the deduction for itemized expenses.
Raising the corporate income tax rate to 35 percent.
According to the original Treasury Department estimates, the Clinton tax hike was to raise federal revenues by 0.36 percent of gross domestic product (GDP) in its first year and by 0.83 percent of GDP in its fourth year, when all provisions were in effect and timing differences associated with near-term taxpayer behaviors had sorted themselves out. In 1997, the fourth-year effect would be roughly equivalent to an increase in the federal tax burden of about $114 billion.

Background

The economic environment at the time of the tax hike is important in assessing its consequences. In January 1993, the economy was entering its eighth quarter of expansion after the 1990-1991 recession. The recession had been relatively mild by historical standards, with a net drop in output of 1.3 percent. Yet even at the start of 1993, the economy was operating below capacity. Capacity utilization in the nation's factories, mines, and utilities was running at about 81 percent, whereas it had been around 84 percent through much of 1988 and 1989. The unemployment rate in January 1993 was 7.3 percent but had averaged 5.3 percent as recently as 1989. At the time of the tax hikes, the economy was recovering but still far from healthy.

Tax policy aside, much in the context of the 1990s was conducive to prosperity. The end of the Cold War brought a new sense of hope and greater certainty to the global economy. The price of energy was astoundingly low, with oil prices dropping to about $11 per barrel and averaging under $20 per barrel compared to prices above $90 per barrel today. The Federal Reserve had finally succeeded in establishing a significant degree of price stability, with inflation averaging less than 2 percent during the Clinton Administration. And, of course, a tremendous set of new productivity-enhancing technologies involving information technologies and the World Wide Web burst on the scene.

Absent a major negative shock, one should have expected a period of unusually strong growth from 1993 onward as the economy more fully employed its available capital and labor resources. In the four years following the Clinton tax hike (from 1993 through 1996):

The economy grew at an average annual rate of 3.2 percent in inflation-adjusted terms;
Employment rose by 11.6 million jobs;[3]
Average real hourly wages rose a total of five cents per hour;[4] and
Total market capitalization of the S&P 500 rose 78 percent in inflation-adjusted terms.
These statistics indicate a solid, but not spectacular, performance in the overall economy. Job growth was strong, as one would expect coming out of recession. Real wage growth remained almost non-existent, and the stock market performed well. But the real question is this: Altogether, did the economy perform better, or worse, because of the tax hike? The data from the period do not provide a clear answer.

The year 1997 was a watershed for both tax policy and the economy. By 1997, the economy had entered into a sustained expansion. The unemployment rate was 5.3 percent, a level thought at the time to be roughly consistent with full employment. Similarly, capacity utilization rates hovered around 82.5 percent; again, roughly consistent with full employment of the nation's industrial capacity. With a mature expansion and the economy running at what was believed to be about full capacity, growth would normally be expected to ease back as the economy makes the transition from recovery to normal growth. It was not a moment when one would expect growth to accelerate.

The 1997 Tax Cut: The Economy Unleashed

In 1997, the Republican-led Congress passed a tax-relief and deficit-reduction bill that was resisted but ultimately signed by President Clinton. The 1997 bill:

Lowered the top capital gains tax rate from 28 percent to 20 percent;
Created a new $500 child tax credit;
Established the new Hope and Lifetime Learning tax credits to reduce the after-tax costs of higher education;
Extended the air transportation excise taxes;
Phased in an increase in the estate tax exemption from $600,000 to $1 million;
Established Roth IRAs and increased the income limits for deductible IRAs;
Established education IRAs;
Conformed AMT depreciation lives to regular tax lives; and
Phased in a 15 cent-per-pack increase in the cigarette tax.
According to Treasury's original estimates, the 1997 tax cut was relatively modest, amounting to just 0.11 percent of GDP in its first year and 0.22 percent of GDP by its fourth year. In 1997, the fourth-year effect would be roughly equivalent to a reduction in the overall tax burden of about $30 billion.

Despite its modest size, tax cut advocates had high expectations for the tax cut's effects on the economy because the reduction in the capital gains tax rate was expected to unleash a torrent of entrepreneurial and venture capital activity. They were not disappointed.

In 1995, the first year for which these data are available, just over $8 billion in venture capital was invested.[5] Venture capital is especially critical to a vibrant economy because high-risk/high-return investment permits promising new businesses to blossom, rapidly spreading new technologies and new ideas into the marketplace and across the economy. Such investments, when successful, generate returns to investors that are subject primarily to the tax on capital gains. By 1998, the first full year in which the lower capital gains rates were in effect, venture capital activity reached almost $28 billion, more than a three-fold increase over 1995 levels, and by 1999, it had doubled yet again.

The explosion in venture capital activity cannot be credited entirely to the cut in capital gains tax rates, as the cut fortuitously coincided with technological developments that gave rise to the Internet-based "New Economy." However, the rapid development and application of these new technologies could not have occurred at such a rapid clip absent the enormous investment flows made possible largely by the reduction in the capital gains tax rate. This experience demonstrated yet again the truth of the axiom: The less you tax of something--in this case, venture capital investment--the more you get of it.

Comparing the Periods

The Clinton years present two consecutive periods as experiments of the effects of tax policy. The first period, from 1993 to 1996, began with a significant tax increase as the economy was accelerating out of recession. The second period, from 1997 to 2000, began with a modest tax cut as the economy should have settled into a normal growth period. The economy was decidedly stronger following the tax cut than it was following the tax increase.

The economy averaged 4.2 percent real growth per year from 1997 to 2000--a full percentage point higher than during the expansion following the 1993 tax hike (illustrated in the graph above). Employment increased by another 11.5 million jobs, which is roughly comparable to the job growth in the preceding four-year period. Real wages, however, grew at 6.5 percent, which is much stronger than the 0.8 percent growth of the preceding period (illustrated in the graph below). Finally, total market capitalization of the S&P 500 rose an astounding 95 percent. The period from 1997 to 2000 forms the memory of the booming 1990s, and it followed the passage of tax relief that was originally opposed by President Clinton.

In summary, coming out of a recession into a period when the economy should grow relatively rapidly, President Clinton signed a major tax increase. The average growth rate over his first term was a solid 3.2 percent. In 1997, at a time when the expansion was well along and economic growth should have slowed, Congress passed a modest net tax cut. The economy grew by a full percentage point-per-year faster over his second term than over Clinton's first term.

The evidence is fairly clear: The tax cuts, especially the reduction in the capital gains tax rate, made a major contribution to a strong economy. Given this observation, it seems likely, though admittedly less certain, that the tax increases in 1993, while not derailing the economy as many had forecast at the time, did indeed slow the recovery compared to what the economy could have achieved.

Conclusion

Proponents of tax increases often reference the Clinton 1993 tax increase and the subsequent period of economic growth as evidence that deficit reduction through tax hikes is a pro-growth policy. What these proponents ignore, however, is that the tax increases occurred at a time when the economy was recovering from recession and strong growth was to be expected. They also ignore that the real acceleration in the economy began in 1997, when economic growth should have cooled. This acceleration in growth coincided with a powerful pro-growth tax cut.

The evidence is persuasive that the tax increase probably slowed the economy compared to the growth it would have achieved and that the subsequent tax cuts of 1997, not the tax increases, were the source of the acceleration in real growth in the latter half of the decade. As taxes are now above their historical average as a share of the economy, and are rising, Congress should look to enact additional tax relief to keep the economy strong.

J.D. Foster, Ph.D., is Norman B. Ture Senior Fellow in the Economics of Fiscal Policy for the Thomas A. Roe Institute for Economic Policy Studies at The Heritage Foundation.

Crafty_Dog

  • Administrator
  • Power User
  • *****
  • Posts: 69383
    • View Profile
Re: Political Economics
« Reply #1657 on: August 29, 2016, 04:13:33 PM »
When did the Soviet Empire collapse?  Wouldn't the "peace dividend" be an important variable here as well?

DougMacG

  • Power User
  • ***
  • Posts: 18236
    • View Profile
Re: Political Economics
« Reply #1658 on: August 31, 2016, 07:02:04 AM »
When did the Soviet Empire collapse?  Wouldn't the "peace dividend" be an important variable here as well?

That's right, the Soviet empire collapse was complete by about 1991, the year before Bill Clinton was elected.  The peace dividend was the talk of the time and one reason people chose a small state governor over a war president. 

The end of the arms race was one factor that made a balanced budget possible.

With government funding stalled, creative talent and technology from the military moved to the private sector, internet protocol, for example, also the silicon valley engineers. 

But the military spending void alone would not have spurred that economic surge without the capital gains rate cuts energizing the venture capital industry, IMHO.

Our complacency and neglect of the military and foreign intelligence in that time led to the success of the next wave of attacks against us, embassies, USS Cole, 9/11, more wars and more military spending.

Crafty_Dog

  • Administrator
  • Power User
  • *****
  • Posts: 69383
    • View Profile
Re: Political Economics
« Reply #1659 on: August 31, 2016, 07:03:19 AM »
A miss on the article's point not to have noted this variable and to have discussed its implications , , ,

DougMacG

  • Power User
  • ***
  • Posts: 18236
    • View Profile
Re: Political Economics
« Reply #1660 on: August 31, 2016, 07:29:10 AM »
A miss on the article's point not to have noted this variable and to have discussed its implications , , ,

Good point on a big omission of the time.  If I may defend him, the peace dividend was held constant in that period while tax policy was greatly changed at a specific point.  It set up a good opportunity to contrast the effects of a policy, and he draws definitive conclusions not seen in mainstream reporting:

Wage rate growth was 8 times higher after capital gains rate cuts.  These are two things we are missing today!

DougMacG

  • Power User
  • ***
  • Posts: 18236
    • View Profile
Re: Political Economics, working age men not working
« Reply #1661 on: September 18, 2016, 02:36:19 PM »
https://www.youtube.com/watch?v=tCOfP3e9Co8

50 years ago 98% of men in this age group worked. 

Now 6 times that proportion sit home, not even looking for work, watch TV.

Disability increases explain only part of this.

Proportion of women working peaked around year 2000.

At the link, Brookings Institution interviews an Obama economist.

Crafty_Dog

  • Administrator
  • Power User
  • *****
  • Posts: 69383
    • View Profile
The Big Lie
« Reply #1662 on: September 20, 2016, 06:53:01 PM »

Crafty_Dog

  • Administrator
  • Power User
  • *****
  • Posts: 69383
    • View Profile
POTH: Millions climb out of poverty
« Reply #1663 on: September 26, 2016, 11:30:11 AM »
No doubt Obama-Hillary will claim credit, and one suspects that this underpins Obama's perplexing high approval ratings , , ,

http://www.nytimes.com/2016/09/26/business/economy/millions-in-us-climb-out-of-poverty-at-long-last.html?emc=edit_th_20160926&nl=todaysheadlines&nlid=49641193&_r=0

DougMacG

  • Power User
  • ***
  • Posts: 18236
    • View Profile
Re: Political Economics, Rate cuts did not bring on a financial collapse.
« Reply #1664 on: September 28, 2016, 08:09:36 AM »
Deconstructing further the economic nonsense the Democratic nominee made this week to a record setting debate audience.  Tax policy too, but the allegation made is trickle down economics, a larger accusation than just tax policy.  Hillary Clinton quotes static analysis that defies the science of economics.  She blames the financial collapse of 2008, under her watch from the majority in the Senate, on the Bush tax rate cuts of 5 years earlier.  She misses that the Bush rate cuts doubled the economic growth rate when they were enacted.  Is she saying that  economic growth causes collapse and therefore we should avoid growth?

The main Bush rates cuts were passed in 2003.  The top rate was cut from 38.6% to 35%.  The lowest rate went from 15% to 10%.  It was not a give away to the rich with the largest percentage decreases actually going to the lowest end of income.  Only in deception can this be called "trickle down", nor do the dates come close to matching the collapse.
https://en.wikipedia.org/wiki/Jobs_and_Growth_Tax_Relief_Reconciliation_Act_of_2003
http://www.moneychimp.com/features/tax_brackets.htm

The rate cuts led to consistent double digit growth in federal revenues, 44% in 4 years from the time they were enacted until the side promising the end of the rate cuts won control of Washington DC at the end of 2006.
http://stats.areppim.com/stats/stats_usxbudget_history.htm

Capital gains revenues DOUBLED by 2005 following the lowering of that rate.  That means the rich are paying more, measured in dollars.

Rate cuts caused the rich to pay more, not less as Hillary Clinton alleged falsely to 80 million people.  From IRS data, the top 1% of income earners paid $84 billion more in federal income taxes in 2007 than in 2000 before the Bush tax cuts were passed, 23% more.  The bottom half of income earners paid $6 billion less in federal income taxes in 2007 than in 2000, a decline of 16%.   It wasn't a giveaway to the rich and it wasn't a loss in revenues.
http://www.forbes.com/sites/peterferrara/2012/12/06/why-america-is-going-to-miss-the-bush-tax-cuts/#5b5bfbca5f38

Clinton is repeating a falsehood that Obama ran on twice and won.  Here is PolitiFact tapdancing around the same issue and getting it wrong:
http://www.politifact.com/punditfact/statements/2015/jun/17/ron-christie/gop-strategist-christie-tax-revenues-rose-after-bu/

Economic growth didn't cause the collapse.  The financial collapse was caused by the certainty that economic growth was coming to an end with the end of the rate cuts and other anti-supply side promises like over-regulation.  The end to wage growth meant an end to the rapid rise in the real estate market.  Investors saw a changed electorate, a changed political climate, Pelosi-Reid-Obama-Biden-Hillary all switching over to majority control, a certain rise in future tax rates coming, and then the trouble began.

More links on this topic:  
http://www.heritage.org/research/reports/2007/01/ten-myths-about-the-bush-tax-cuts

Hillary Clinton's Zany Debate Claim That Tax Cuts Caused The Financial Crisis
http://www.forbes.com/sites/theapothecary/2016/09/27/hillary-clintons-zany-debate-claim-that-tax-cuts-caused-the-financial-crisis/#48a4963019e4
« Last Edit: September 28, 2016, 11:59:38 AM by DougMacG »

DougMacG

  • Power User
  • ***
  • Posts: 18236
    • View Profile
Our Productivity is Declining!
« Reply #1665 on: October 25, 2016, 08:50:19 AM »
If this election was about economics (and why isn't it?), wouldn't you want to be able to make the people and the country more prosperous?  One set of policies advances that and the other set of polices diminishes it.

Pointed out previously, wage growth was 8 times better under Clinton after tax rate cutting than in the early years when he was raising taxes and working on national healthcare.

Why don't results of policies matter over sounds good ideology?

It is Year 8 for the Obama Administration and productivity is declining.  This isn't about Bush; this is either a bug or a  feature of their economic design.  They put their distorted definition of fairness ahead of growth and got neither.  Income inequality widened.  Program dependency broadened.  Workforce participation continued to decline.  Entrepreneurism nearly vanished.  And wage growth, for the most part, ended.

You can't launch an attack on capital, essential to labor, without hurting labor.  These issues are as old as the hills, and we (at least half the electorate) keep learning nothing.  The economy is interconnected, and the rhetoric that some policy like tax hikes will only hurt the top 1 or 2% is always complete BS, whether out of ignorant or intentionally deception.

One article noting the decline in productivity - and the reasons for it:
https://economicsone.com/2016/10/16/take-off-the-muzzle-and-the-economy-will-roar/
http://www.wsj.com/articles/why-the-economy-doesnt-roar-anymore-1476458742

In his Saturday Wall Street Journal essay “Why the Economy Doesn’t Roar Anymore”—illustrated with a big lion with its mouth shut—Marc Levinson offers the answer that the “U.S. economy isn’t behaving badly. It is just being ordinary.”  But there is nothing ordinary (or secular) about the current stagnation of  barely 2 percent growth. The economy is not roaring because it’s muzzled by government policy, and if we take off that muzzle—like Lucy and Susan did in “The Lion, the Witch and the Wardrobe”—the economy will indeed roar.

It is of course true, as Levinson states, that “faster productivity growth” is “the key to faster economic growth.” But it’s false, as he also states,  that it has all been downhill since the “long boom after World War II” and “there is no going back.” The following chart of productivity growth drawn from my article in the American Economic Review shows why Levinson misinterprets recent history. Whether you look at 5 year averages, statistically filtered trends, or simple directional arrows, you can see huge swings in productivity growth in recent years.  These movements—the productivity slump of the 1970s, the rebound of the 1980s and 1990s, and the recent slump—are closely related to shifts in economic policy, and economic theory indicates that the relationship is causal, as I explain here and here and in blogs and opeds. You can also see that the recent terrible performance—negative productivity growth for the past year—is anything but ordinary.  Productivity Growth


Writing about the 1980’s and 1990s, Levinson claims that “deregulation, privatization, lower tax rates, balanced budgets and rigid rules for monetary policy—proved no more successful at boosting productivity than the statist policies…” The chart shows the contrary: productivity growth was generally picking up in the 1980s and 1990s.  It is the stagnation of the late 1960s, the 1970s, and the last decade that is state-sponsored.  To turn the economy around we need to take the muzzle off, and that means regulatory reform, tax reform, budget reform, and monetary reform.
« Last Edit: October 31, 2016, 11:13:52 PM by Crafty_Dog »


DougMacG

  • Power User
  • ***
  • Posts: 18236
    • View Profile
Re: Canada testing guaranteed income
« Reply #1667 on: November 16, 2016, 08:14:39 AM »
http://bigthink.com/natalie-shoemaker/canada-testing-a-system-where-it-gives-its-poorest-citizens-1320-a-month?utm_campaign=Echobox&utm_medium=Social&utm_source=Facebook#link_time=1479241883

"What Happens When You Give Basic Income to the Poor? "

Is income the only thing poor people are missing?

As we had with static scoring of massively different tax and spend alternatives here, does anyone believe that providing a comfortable income without working (along with legalization of marijuana) will have no effect on the incentive or disincentive to produce?

75% death tax will not affect the incentive to build wealth. 

Highest business taxes in the world is not why companies are leaving. 

And punishing capital investment is not related to productivity and wage stagnation, no connection.

Which side again has the deniers of science?  Or is economics not a science?

It fits perfectly with the mentality here with minimum wage law is how you raise incomes of 'minimum wage workers'.  Why can't Haiti pass a $15 minimum wage law or 1320/mo minimum income decree and vote itself out of poverty?  Is it possible something else is missing?


Crafty_Dog

  • Administrator
  • Power User
  • *****
  • Posts: 69383
    • View Profile
Re: Political Economics
« Reply #1668 on: November 16, 2016, 08:25:21 AM »
I think the argument is that this will replace welfare, not add to it.


DougMacG

  • Power User
  • ***
  • Posts: 18236
    • View Profile
Re: Political Economics
« Reply #1669 on: November 17, 2016, 12:55:46 PM »
I think the argument is that this will replace welfare, not add to it.

In that case, this is an idea that Milton Freidman used to put forward.  He was making the point we could give them quite a bit directly in place of all the bureaucratic programs.

I am still skeptical that Ontario will do this in lieu of all other programs, they still get free health care for example.  Nor will they be able to keep it at 1320 or measure its success by how many people no longer need it.  I am also skeptical that formalizing the idea that all people are entitled to a decent paycheck whether they work or not is not in direct contradiction to crucial incentives to produce.

The current system of receiving a myriad of programs and free money that other people earned is “seriously demeaning”.

How about minimum income with a minimum work requirement, set at a humane limit of what each person is able to do, with a built-in incentive to get off of it.

Our welfare reform under Bill Clinton and Newt Gingrich was mainly a work requirement to receive welfare and that had a tremendous result from my point of view.   Since then other programs have grown around that.
« Last Edit: November 17, 2016, 01:11:19 PM by DougMacG »

Crafty_Dog

  • Administrator
  • Power User
  • *****
  • Posts: 69383
    • View Profile
NRO on the Carrier deal
« Reply #1670 on: December 03, 2016, 09:52:25 PM »

Crafty_Dog

  • Administrator
  • Power User
  • *****
  • Posts: 69383
    • View Profile
WSJ: Trump Rally vs. Bannonomics
« Reply #1671 on: December 04, 2016, 05:15:21 PM »
Trump Rally vs. Bannonomics
President Trump won’t get the mileage out of protectionism that Reagan did.
The presidential adviser at Trump Tower in New York, Oct. 7. ENLARGE
The presidential adviser at Trump Tower in New York, Oct. 7. Photo: Associated Press
By Holman W. Jenkins, Jr.
Updated Dec. 2, 2016 2:32 p.m. ET
259 COMMENTS

A surprise win, with House and Senate in tow, by any Republican presidential candidate would probably have been greeted with the upward repricing of stocks we’ve seen since Donald Trump’s election.

A Republican named Donald Duck, under the circumstances, would have heralded a pleasantly unexpected end to the Obama regulatory war on business, a fresh start on tax reform, a chance for a rational overhaul of ObamaCare.

Recall, the big questions had been how much would Hillary Clinton win by, and would Republicans lose the Senate. These expectations had to be quickly revised.

Then again, any other Republican might have been seen as a shoo-in, so the good news on taxes and regulation would already have been priced in.

Even more bracing to consider, any other Republican besides Mr. Trump (truly a Republican in name only) would have arrived without the uncertainties, unpredictability and baggages of Mr. Trump: His business conflicts. His trade-war threats.

Bob Doll, the equity strategist for Nuveen, says the market will be up only as long as “growth Donald Trump” is seen triumphing over “protectionist Donald Trump.”

Which brings us to Steve Bannon.

In my one encounter with the then-Breitbart propaganda chief, he informed me that I was a global elitist so-and-so. The occasion was a private dinner. I had suggested that tax and regulatory reform would be a better way to re-energize the U.S. economy rather than engaging in Trumpian trade fights. (Admittedly, I may also have mentioned that blaming foreigners has been a favorite tactic of demagogues from time immemorial.)

Now Mr. Bannon is a senior adviser to the Trump administration, and the markets are hoping my advice will prevail.

In lore, Ronald Reagan was anti-union. In fact, he was the best friend auto and steelworkers ever had, imposing “voluntary” import restraints that delayed a brutal industrial downsizing.

Some jobs were preserved for a while. What was mostly preserved was an opportunity for shareholders to extract profits under government protection. And this is the best you can expect from trade policy. It won’t restore small-town America to a landscape of thriving factories and mines. It won’t provide high-paying, reliable employment to high-school graduates.

Mr. Trump may succeed in jawboning Carrier Corp. not to move several hundred jobs to Mexico, but he lacks the opportunity that even Reagan had, with the connivance of a couple of major allies, to put a safety net under two giant, centralized, union-dominated industries and keep a million jobs going awhile longer.

Expansionist autarky, the Bannon world view, is even less plausible now than it was in the 1930s. The U.S. can cut Apple off from its million-man army in China. Those jobs won’t be coming here because nobody would do them at a price Apple would be willing to pay.

Or take health care: We’d have to cut back our prodigal consumption —$3 trillion worth last year, virtually all of it domestically produced—if we also had to produce the $500 billion in net imports we consume each year.

Trade by now is crucial even to sustaining our precious follies. Why does Ford build small cars in Mexico? Partly to offset the cost of Congress’s belovedly zany fuel-mileage rules, partly to offset the oddest dispensation in Christendom: the fact that foreign auto makers in the U.S. enjoy a free labor market while the Big Three are politically obliged to patronize a UAW labor monopoly left over from the Roosevelt era.

Mr. Bannon is right about one thing, though: A country is more than just an economy.

New railroad hires, after two years on the job, are entitled to job security, plus a six-figure salary, plus attractive benefits. And yet half the room empties out, a top executive tells me, when potential recruits hear they would have to submit to regular drug tests and might have to relocate to Bismarck, N.D. Rail companies have been reduced to trying to hire military vets off the plane before they can return to their hometowns and bad habits.

Nearly one-fifth of males between the ages of 21 and 30 who haven’t completed college aren’t working today and aren’t in school—an increase of 125% since 2000. Yet many of these young men are satisfied with their situation because it frees up time to play videogames, according to research by the University of Chicago’s Erik Hurst and colleagues.

There is a problem in post-manufacturing, small-town America, all right, but winding back the clock is not an option. We need other options.

An outbreak of Trumpian optimism might at least boost the morale of this struggling America. Tax and regulatory reform might at least get businesses investing again, giving these workers the tools to raise their productivity and potential wages.

Let’s hope so, because this is the best and only help these Americans are likely to get from their government. And some who are whispering in Mr. Trump’s ear would screw even this up.


Crafty_Dog

  • Administrator
  • Power User
  • *****
  • Posts: 69383
    • View Profile
The Progressive State Depression
« Reply #1673 on: December 22, 2016, 10:42:50 AM »
•   The Progressive-State Depression
<StephenMoore.gif>
Stephen Moore
|
Posted: Dec 06, 2016 12:01 AM


The blue states of America are in a depression. I don't mean the collective funk of liberal voters because they lost the election to Donald Trump.

I'm talking about an economic malaise in the blue states that went for Hillary Clinton. Here is an amazing statistic courtesy of the just-released 2016 edition of "Rich States, Poor States," which I co-authored with Reagan economist Arthur Laffer and economist Jonathan Williams: Of the 10 blue states that Democrats won by the largest percentage margins -- California, Massachusetts, Vermont, Hawaii, Maryland, New York, Illinois, Rhode Island, New Jersey and Connecticut -- every single one of them lost domestic migration (excluding immigration) between 2004 and 2014. Nearly 2.75 million more Americans left California and New York than entered these states.

They are the loser states. They are all progressive: high taxes rates; high welfare benefits; heavy regulation; environmental extremism; high minimum wages. Most outlaw energy drilling. The whole left-wing playbook is on display in the Clinton states. And people are leaving in droves. Day after day, they are being bled to death. So much for liberalism creating a worker's paradise.

Now let's look at the 10 states that had the largest percentage vote for Trump. Every one of them -- Wyoming, West Virginia, Oklahoma, North Dakota, Kentucky, Tennessee, South Dakota and Idaho -- was a net population gainer.

This is part and parcel of one of the greatest internal migration waves in American history, as blue states, especially in the Northeast, are getting clobbered by their low-tax, smaller-government rivals in the South and the mountain regions.


By the way, pretty much the same pattern holds true for jobs. The job gains in the red states that Trump carried by the widest margins had about twice the job-creation rate as the bluest states carried by Clinton.

The latest "Rich States, Poor States" report, published by the American Legislative Exchange Council, shows a persistent trend of Americans moving from blue to red states. The best example is that from 2004-2014, the two most populous conservative states -- Florida and Texas -- gained almost 1 million new residents each. The two most populous liberal states -- California and New York -- saw an equal-sized exodus.

It's easy to understand why people might want to leave gray and rusting New York. But California? California has, arguably, the most beautiful weather, mountains and beaches in the country, and yet people keep fleeing the state that is supposed to be a progressive utopia.

What doesn't make California and New York paradise is the high cost of living -- thanks to expensive environmental regulations, forced union policies and income tax rates that are the highest in the nation, at 13 percent or more. Florida and Texas are right-to-work states with no income tax. Is it really a shocker that people would choose zero income tax over 13 percent? New York politicians know that their record-high tax rates are killing growth, which is why the state is spending millions of dollars on TV ads across the country trying to convince people that New York has low taxes. Sure. And Chicago is crime-free.

Even when it comes to income inequality, blue states fare worse than red states. According to a 2016 report by the Economic Policy Institute, three of the states with the largest gaps between rich and poor are those progressive icons New York, Connecticut and Massachusetts. Sure, Boston, Manhattan and Silicon Valley are booming as the rich prosper. But outside these areas are deep pockets of poverty and wage stagnation.

The lesson to be learned from the experimentation of the states is that the "progressive" tax and spend agenda leads to much slower growth and benefits the rich and politically well-connected at the expense of everyone else.

Trump is now promising that on a national scale, he will cut taxes, deregulate and cut wasteful government spending. In the presidential debates, Clinton disparaged this agenda as "trumped up, trickle-down economics," and she said it had never worked.

Yet prospering red states such as Florida, Tennessee, Texas and so many others keep stealing jobs and growth from blue-state America.

DougMacG

  • Power User
  • ***
  • Posts: 18236
    • View Profile
Political Economics - The Inequality Hype
« Reply #1674 on: January 05, 2017, 10:41:56 AM »
Good to see more experts weigh in on this.  Piketty debunked (again).  Inequality is the ladder there for everyone to climb.  It isn't a bad thing that people in different careers, at different points in their careers, with different effort levels and different talents get different pay.  It's how our most scarce resource, our time, gets allocated best.  But it gets measured wrong and then hyped for political and economic folly.  I suppose this debate has been going on since Adam and Eve but it restarted in the Bush years as a way of saying a good and growing economy was bad.  Mis-measure the differences and then sound the alarm.  The point of the deception was to foster dissatisfaction with economic growth and gain support for greater redistribution.  

John F Kennedy said a rising tide lifts all boats.  He didn't say all boats have to be the same size and travel at the same speed, now matter how small or slow or how vulnerable they would have to be to the next wave.
-----------------------------------------------------------------------------------------------

http://www.the-american-interest.com/2017/01/03/the-inequality-hype/

The Inequality Hype
NEIL GILBERT
The great devil of progressives turns out to be mainly a figment of accounting. Better data gives us a more heartening picture of American well-being.

For most of the 20th century, poverty represented the root of all evil to Americans—sprouting criminality, violence, hunger, disease, stunted achievement, and premature death. With the tremendous growth of both the economy and the welfare state over the past sixty years, the political campaign against poverty has almost vanished from the public square. Today, many see economic inequality as the root cause of most, if not all, of our social ills. President Obama described it as the defining challenge of our time—one that threatens “the very essence of who we are as a people.”

It should go without saying that poverty and inequality are not the same. However, it’s worth repeating, because over time a conflation of the two has taken root in common perceptions. The evils once associated with poverty have been transferred lock, stock, and barrel to inequality, whether justifiably or not.

Although political efforts to reduce income (and wealth) inequality do not carry the moral force of religious edicts (leaving aside those for whom Das Kapital has assumed biblical status), they have an intuitive moral appeal not dramatically different from appeals to reduce true poverty—again, since both are seen as causing the same cluster of social evils. Long before any exposure to ideas of social justice one typically hears young children yelling “that’s unfair!” when a pie is divided unequally among them; the quickest to complain are invariably those handed the smallest slices.

And why shouldn’t they? All else equal, there seems to be little ethical justification for one child to get a bigger slice of the pie. As adults we usually make peace with reality by recognizing that it is rarely if ever the case that all else is equal. Karl Marx got around this problem by arguing that the secret expression of value, namely that all kinds of human labor are equal and equivalent, because in so far as they are human, labor in general cannot be deciphered until the notion of human equality has acquired the fixity of a popular prejudice.

For Marx, in other words, all human labor has the same value because we are all equal in what he deems people’s most important characteristic—their humanity. This tautological formulation skirts the issue of how, or even whether, to adjust for merit (and of course it famously leaves out every other factor of production in an economy, but never mind about that for now).

Since classical antiquity the balance between merit and equality has animated philosophical debate about what constitutes a just distribution of material goods. Aristotle believed that a fair and just distribution could not ignore merit, which, once taken into consideration, made a fair distribution essentially an unequal one. He qualified the idea that “equal” is just by differentiating between numerical and proportional equality. The former dictates that everyone gets exactly the same basket of goods, while latter prescribes that the amount of goods received by different people be relative to the amount of effort each contributed to their production. With this deft distinction, Gregory Vlastos observes, “the meritarian view of justice paid reluctant homage to the equalitarian view by using the vocabulary of equality to assert the justice of inequality.”1

Still, the case for reducing inequality made in the political arena appeals to the intuitive sense that fair means equal. All that is being asked is that millionaires and billionaires pay their fair share. This leaves aside the meritarian question of whether they legitimately deserve to possess such vast wealth in the first place. For the most part, proposals to advance equality by taxing tycoons evoke little public opposition. Whether or not targeting this group is really just, many argue that the millionaires can easily afford it. Others question how lawfully the super-rich came by their wealth in the first place, and still others, law aside, assert that all wealth distribution systems are based ultimately on coercion, made necessary by the original sin of private property. The merely progressive as opposed to radical case for income redistribution gains added support from the prevailing assumption that economic inequality is inherently bad because it causes stress, low self-esteem, and a whole raft of dubiously medicalized effects. This assumption reflects the growing tendency to conflate the equality of material outcomes with the incontestable fair-mindedness of equal opportunity.

Champions of increasing economic equality have an emotionally compelling argument that ensures the moral high ground for those making the case. It is not an argument that any sensible politician (or aspiring academician, as opposed to a professional gadfly like the Princeton philosophy professor Harry Frankfurt) wants to enter on the other side.2 Thus in contemporary Western political discourse equality is so thoroughly vested as an abstract good that questions are rarely raised about exactly how much economic inequality is unacceptable, how much is fair, or even how much really exists. The next time someone lectures you about the need to increase equality, you might try asking: How much should we have? As much as Sweden, is one likely response. But inequality has been on the rise in Sweden as in most other industrialized countries, so is the acceptable level that of Swedish equality in 1995 or 2016? Now there’s a conversation stopper for you.

Income inequality is at once a palpable and amorphous condition. That some people have more money than others is a tangible reality. But most people have no idea about the actual distribution of income and their position in the population. An analysis of several surveys of ordinary citizens in nearly forty countries reveals widespread misperceptions about the degree of inequality, how it is changing and where they fit in their country’s income distribution. For example, in the countries surveyed an average of 7 percent of respondents owned a car and a second home, yet on average 57 percent of this group thought they belonged in the bottom half of the income distribution. Among low-income respondents receiving public assistance, a majority placed themselves above the bottom 20 percent of their income distribution. These findings raise serious doubts about the extent to which the median voter knows how much she might lose or gain from redistribution. More important, it means that discontent with economic trends has a lot less to do with perceptions of material inequality than it does with a whole host of other factors that are, as it happens, a lot harder to quantify and therefore much less well appreciated by elites.

Metrics of Inequality and Material Well-Being

In contrast to the normative moral appeals and vague calibrations of fairness in political discourse, the quantitative metrics of social science lend a certain precision to estimates of income inequality. However, these empirical estimates and especially what they signify rest on loose soil that offers fertile diggings for economists and philosophers less interested in facts than in changing facts. To really grasp the essential meaning of economic inequality requires examining how income is measured in relation to demographic changes, geographic differences, and shifting fortunes over the life course. But if that interferes with the propagation of a certain ideological position, then these requirements go unrequited. Let’s look more closely at the facts before we deign to tamper with them.

Income inequality in the United States is generally perceived to have increased over the past thirty years. However, the degree and implications of this trend remain in dispute. The disagreement reflects, in part, differences in the way economists measure inequality, which are rarely aired outside of technical publications. Even when the different measures are reported, what they signify is difficult to discern beyond whether the numbers are going up or down.

The most common measures of inequality include the Gini index and a comparison of income quintiles. They vary in convenience and transparency. The Gini index provides an expedient summary ranging from 0 to 1; zero denotes perfect equality of income and 1 represents a distribution in which one member possesses all the society’s income. Among the advanced industrialized countries Gini coefficients range from .250 to .500. By summarizing the dispersion of income in one number, Gini coefficients are useful for comparative purposes. They clearly show whether economic inequality is increasing or decreasing over time and is higher or lower among countries.

However, the numerical precision veils the existential reality of inequality, particularly in a country as large as the United States. That is, the numbers convey an empirical impression that those with an annual income of $100,000 have a higher standard of living than those with an income of $85,000. If this were not the case, why be concerned about income inequality in the first place?

But in fact it is often not the case. The U.S. Bureau of Economic Analysis documents strikingly large differences in the cost of living throughout the country.3 Thus, for example, when regional price differences are factored in, a $100,000 income in New York State is worth less than an $85,000 income in Montana. Some might argue that it is worth the difference to live in New York. Having come from New York City, like many of my friends I once believed that civilization ended on the east bank of the Hudson. Yet people have different preferences for cultural amenities and natural beauty—and different levels of tolerance for traffic, noise, smog, and cramped apartments. Montanans typically refer to their state as “the last best place,” which may explain the influx of wealthy people over the past few decades. Cost-of-living differences are even more extreme among metropolitan areas. The San Francisco Bay area is almost 40 percent more expensive than Rome, Georgia, a charming locale nestled in the foothills of the Appalachians. Since the cost of living is usually higher in states and metropolitan areas where the average household income is above the U.S. median, the Gini coefficient tends to exaggerate differences in the levels of material comfort and well-being implied by economic inequality.

Moreover, despite the suitability of Gini coefficients for comparing levels of income inequality over time and among countries, the findings expressed by these comparisons can obscure their implications for economic well-being. For example, the .378 Gini coefficient for the United States represents a much higher degree of income inequality than the .257 computed for the Slovak Republic. As for economic well-being, a look at how much money is actually available reveals that the Slovak Republic’s median disposable household income amounts to 29 percent of that of the United States.4 Its middle-class would be on welfare here.

Finally, the Gini coefficient lends numerical precision to the assumption that increasing economic equality is a social improvement. Yet during a recession economic equality as measured by the Gini index may well increase in a country where everyone is getting poorer. Earnings fall for people in both the upper and lower income brackets, but the decline is steeper for those at the higher end who have more to lose in the first place. By the same token, a country could experience rising inequality according to its Gini index when everyone is becoming better off. The rich are getting richer as the poor are also getting richer, just not as much. Rising inequality, however, can also signal that the rich are getting absolutely more and the poor are getting absolutely less. But the Gini coefficient metric by itself is powerless to tell you which is which.

So, are the rich getting richer and the poor getting poorer? A 2012 Pew Research Center survey found 76 percent of the public answered “yes,” which was about the same as the 74 percent who held this view in 1987.5 In contrast to the Gini coefficient, which cannot answer the question, the analysis of income quintiles entails a direct examination of how money is distributed among the different groups, revealing the extent to which their incomes are rising or falling. Calculating the financial resources of five groups that range from the top to the bottom 20 percent of the income distribution, this approach illuminates the economic well-being of families and how they fare over time. But here, too, the results vary according to the alternative definitions of income.

Thomas Piketty and Emmanuel Saez’s well-known study of income inequality in the United States, for example, was based on the market income of tax filers.6 According to this definition, from 1979 to 2007 there was a 33 percent decline in the mean income of those in the bottom quintile in contrast to a 33 percent increase among those in the top 20 percent of tax units. Thus, left entirely to its own devices, the market allocation of income generated a pattern of increasing inequality wherein the rich got noticeably richer and the poor got poorer—a bleak testimony, supposedly, to the distributional problem of capitalism.

However as Richard Burkhauser pointed out in his presidential address to the Association for Public Policy Analysis and Management, the market income of a tax unit is a poor indicator of how much money families actually have to live on.7 A more inclusive measure of the income that remains in households after subtracting what they must pay in taxes and adding the money they receive through government transfers transmits a different image of the American experience. Applying these criteria, instead of a decline we see a 32 percent increase in the mean income of the poorest fifth between 1979 and 2007. (Table 1) Overall, this broader measure still reveals a rise in inequality during that period as the mean income of those in the top bracket climbs by 54 percent.8 But it, too, is incomplete.


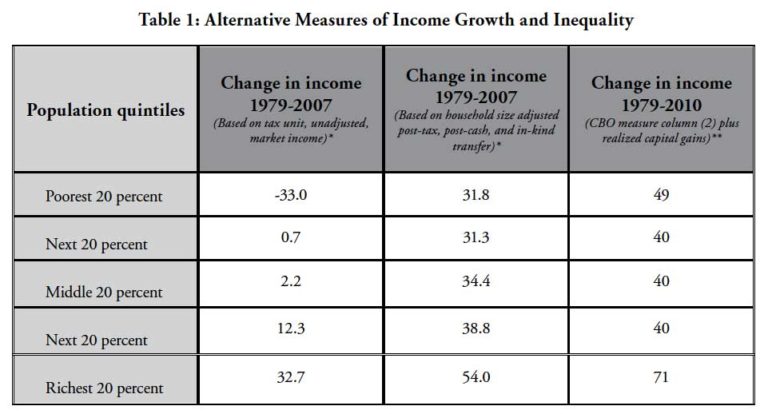
Source: * Philip Armour, Richard V. Burkhauser, and Jeff Larrimore, “Deconstructing Income and Income Inequality Measures: A Crosswalk from Market Income to Comprehensive Income” American Economic Review (May, 2013). ** Congressional Budget Office, “The Distribution of Household Income and Federal Taxes, 2010” (Government Printing Office, 2013).

Along with taxes and transfers, the most authoritative and extensive measure of income also incorporates capital gains. Along with Burkhauser and his colleagues, the nonpartisan Congressional Budget Office (CBO) agrees that a comprehensive definition involves the sum of market income adjusted for taxes, household size, cash and in-kind transfers, and capital gains.9 However, the consensus unravels over the issue of exactly how to value capital gains. The basic choice is whether to focus on the total taxable gains realized in the year capital assets are sold or the annual change in value of capital assets whether or not they are sold. This is not just a matter of bookkeeping. The choice to include either realized or accrued capital gains in the calculation of annual income has a considerable impact on the rates of inequality.

The CBO favors the use of realized capital gains that are reported on tax returns. After factoring in the impact of taxes, capital gains, and government transfers the CBO data reveal a sharp decline in inequality compared to when it is measured solely by market income. According to these figures, between 1979 and 2010 the household income in the bottom quintile increased by 49 percent, the income in the middle three quintiles increased on average by 40 percent, and those in the highest bracket increased by 71 percent.10 While incomes increased across the board, the largest gains registered on the two ends of the income distribution. These findings temper progressive arguments that focus on the increasing inequality of market incomes to demonstrate the need for greater social welfare spending.

The income measures cited above all indicate a rising level of inequality that varies only in the rate at which it seems to have increased over the past three decades. In contrast, a different picture emerges if accrued capital gains, which include housing, are substituted for realized taxable gains. This approach yields a reversal of income trends between 1989 and 2007, which shows a decline in inequality as the household income in the bottom quintile climbed at a rate considerably higher than the increase experienced in the top quintile, which was hit much harder by the housing market crash in 2007. Needless to say, the choice between these methods of valuing capital gains is highly contested.

Every pertinent measure of income quintiles, especially the widely acknowledged comprehensive assessment by the CBO, dispels the notion that within the United States over the past three decades the rich have been getting richer as the poor have gotten poorer. The CBO measure reveals that from the highest to the lowest quintile, the mean household income of every group was lifted, even amid a rising tide of inequality. Among the bottom fifth the mean income increased by 49 percent. That’s not peanuts, particularly when we recognize what else is happening.

Another Dimension: Looking Within the Groups

Although the analyses of change since 1979 illustrate the extent to which household incomes climbed while the gap between the bottom and top fifths widened, it’s a one-dimensional picture that discounts what was happening within these economic bands. This image conveys a static impression that the same households within each quintile were experiencing these changes over time. In truth, a lot more was going on among the households within these five divisions, the particulars of which lend depth to the one-dimensional story of increasing economic inequality.

To grasp the full implication of rising inequality in household income, it is important to recognize that during the period in question young workers were continually entering the labor force as the older generation retired and died. A 25 year old who began working in 1979 while living on his own with an income in the bottom 20 percent would very likely reach a higher bracket by the time he was 53 years old in 2007. So not only did entry-level income rise between 1979 and 2007, but over the course of time many of those who started out at the bottom climbed toward the top. In just the period from 1996 to 2005, for example, the U.S. Treasury Department estimates that about half of the taxpayers starting in the bottom 20 percent moved into a higher income bracket.11 Of course, we do not know how many members of this upwardly mobile group were young scions spending their first year out of Princeton as shipping clerks in their fathers’ factory, serving Teach for America in a poor rural area or lolling lazily on the Left Bank—a reminder that numbers can impose a surface on patterns that shields us from the underlying reality.

There is even more to this story. As time passed, the 25 year old got married and had two children. Thus, what started in 1979 as a single-person household in the bottom fifth of the income distribution had morphed into a middle-income household with four people by 2007. This change illustrates an important characteristic of the income quintiles. Although they represent five groups with an equal number of households, the average number of persons per household within these groups varies as do other characteristics such as family structure and employment. The top fifth of households contain 82 percent more people than the bottom fifth. The proportion of married couples in each group ranges from 17 percent in the lowest income quintile to 78 percent in the highest. At the same time, single men and women living alone account for 56 percent of the households in the bottom fifth, but only 7 percent among the top group. And no one was employed in more than 60 percent of the households in the bottom quintile; while 75 percent of the households in the top quintile had two or more earners.

Taking account of the household characteristics within each quintile reveals that to some extent the increasing level of income inequality since 1979 coincides with the changing demographics of family life, particularly the smaller number of persons per household, the decreasing rate at which couples form and maintain stable marriages, and the increasing number of two-earner households. On that score, W. Bradford Wilcox and Robert I. Lerman estimate that 32 percent of the growth in family income inequality since 1979 is linked to the retreat from marriage and the decline of stable family life.12 The point, again, is that economic data are not self-interpreting, and that without a relevant sociological filter they can be made to mean almost anything except what they actually mean.

Concentrating on advances within just the top quintile offers a different perspective, which sharpens our understanding of what is behind the rising level of economic inequality in recent years. Two prominent findings based on the CBO’s all-inclusive measure of income tell the story: From 1979 to 2010 the after-tax income of the top 1 percent increased by 201 percent (compared to the 49 percent increase for households in the bottom quintile and the 65 percent increase for those in the 81st to 99th quintile).13 Research focused on the pre-tax market income of the top 1 percent generates an even higher level of inequality than the CBO findings.

Thus, a disproportionate degree of the increasing level of inequality was due to significant financial gains made by those at the apex of the income pyramid. As for the rest, a careful analysis matching data from the U.S. Census Bureau and Internal Revenue Service demonstrates that after 1993 there was no palpable increase of inequality among the bottom 99 percent of the population. Since the pre-tax incomes of the top 1 percent started at $388,905 in 2011, many of these families would not be considered the super-rich. It’s around the top one-tenth of 1 percent, where pre-tax incomes start at $1,717,675, that we begin to cross the line between relatively well-off and truly affluent.

As soon as the conversation on inequality begins to concentrate on the wealthiest households, the question increasingly comes to mind: What do these people do to deserve such immense rewards? A 2013 study commissioned by the New York Times discloses a median executive pay of $13.9 million among the CEOs of 100 major firms, described by one journalist as a “new class of aristocrat.”14 Although not terribly harsh, this description connotes a privileged class renowned more for its leisure pursuits than its productive labor. But it does suggest how easily personalizing the numbers can transform a dispassionate report on the top 1 percent into bitter accounts of debauchery and corporate corruption. The likes of Bernie Madoff, Tyco’s Dennis Kozlowski, and Ken Lay of Enron supply no shortage of infamy on which to justify a denial of merit. But then there are the brilliant hard-working multi-millionaires who created Apple, Google, and Microsoft, not to mention our favorite movie stars and athletes. Even here some might question why grown men should receive immense sums of money to stand around a few afternoons a week waiting for a chance to hit a ball with a big stick. Major League baseball players were paid on average $3.39 million in 2013. In contrast, for the same activity most minor league players earned between $2,500 and $7,000 for a five-month season—talk about inequality!

Like it or not, in a capitalist system the criterion for reward is ultimately associated with what the market will bear. Of course, many people doubt just how well this standard works in practice. They wonder, for example, how difficult it might be to replace a CEO earning $20 million a year with an equally qualified executive who would accept half that salary. Also, market demand is no guarantee of social value or cultural enlightenment. A writer’s worth varies by the number of readers willing to plunk down the price of a book, regardless of how crass or meaningless the content. Alas, Fifty Shades of Gray has earned millions, while my publishers will be fortunate to clear the all-too-modest advance awarded for Never Enough: Capitalism and the Progressive Spirit. What the market will bear is certainly an imperfect calibration, but most people still think it preferable to having the standard set by bureaucratic quotas or political bargains, though both are often in play, as well.

How Has the Middle Class Really Fared?

Politicians on both sides of the aisle contend that the middle class is being crushed by inequality and diminishing income. But with household incomes increasing amid rising inequality, what do the facts tell us about the real material state of the middle class? There are several ways to answer this question, depending on how the middle class is defined and the benchmarks against which its progress and well-being are measured. The historical absence of an aristocracy has bred a fluid sense of social class and a democratic ethos that instills a degree of reluctance in Americans to identify as “upper class.” Thus, the middle class is a well-regarded, if ill-defined, status to which most Americans subscribe. It is typically associated with one’s income, education, and occupation. Numerous polls capture the propensity of Americans to identify themselves as somewhere along the spectrum of lower-middle to upper-middle class.

When policymakers and the media talk about the middle class, however, it is usually defined by economic divisions. Estimates vary regarding the range of income that delineates the middle class, as well as the interpretation of how the economic fortunes of this group have changed over time. Thus, reviewing the same Census Bureau data the New York Times decries, “Middle Class Shrinks Further as More Fall Out Instead of Climbing Up,” while ten days later the Pew Research Center announces, “America’s ‘Middle’ Holds Its Ground After the Great Recession.”15 Both of these captions are correct and neither highlights the larger story in the data, which only underscores how those who write the headlines may parse the numbers to express the points they wish to publicize. The economic definitions of the middle class in these reports differ: $35,000-$100,000 in the New York Times and $40,667-$122,000 in the Pew study. But the findings are very similar. Both show a substantial contraction of about 10 percent in the size of the middle class, which started shrinking around 1970. Though it sounds ominous, this decline is not necessarily a distressing trend. It depends on where those who were squeezed out of the middle class ended up. If they all moved into the upper income brackets, everyone’s better off.

So where did they go? The answer hinges on the years in question. The New York Times headline focused on the period from 2000 to 2013, the decade of the Great Recession during which the middle class declined by around 2 percent, the upper-income group also declined by about 3 percent, and the lower-income group increased. The Pew caption referred to the period from 2010 to 2013, just after the Great Recession. Over this interval the size of the middle class remained stable, and there was even a small uptick in the upper-income group and a slight decline in the lower-income group.

Despite the fluctuation of a few percentage points during the Great Recession, the larger story in the New York Times report is that between 1967 and 2013 both the lower-income and the middle-income groups contracted while the size of the upper-income group expanded by 15 percent. From this perspective the shrinking of the middle class (and of those in the lower-income bracket) is directly connected to a significant advance in economic well-being as the combined size of the middle- and upper-income groups grew by 5 percent.

Thus, while the New York Times headline evoked a disheartening picture of middle-class decline, the data easily yield a more promising interpretation of the middle-class experience since 1970. The Pew findings offer a somewhat different conclusion, in part because the middle-class definition was pegged at a higher level of income. Although the middle-income group fell by 10 percent, about 6 percent of those who left had climbed into the upper-income category. What a way to go.

Of course, there are other benchmarks against which to evaluate the economic progress and status of the U.S. middle class. Certainly, those concerned about inequality would judge that the middle class has not fared very well in comparison to the income gains realized by the country’s top 1 percent. True; but consider everyone else on the planet. The U.S. middle class boasts among the highest disposable household incomes in the world. The average U.S. family has 38 percent more disposable household income than a family in Italy, 25 percent more than a family in France, and 20 percent more than a household in Germany, when adjusted for differences in purchasing power. (Of course, that doesn’t take fully into account the more efficient provision of many services in Western Europe via the public route: think health care, for example. Which only confirms the point that numbers alone cannot really tell us very much.)

Although some academics invest considerable intellectual energy in debating how to quantify inequality and the significance of change in measures such as the Gini coefficient, most members of the middle class have no idea whether this index is going up or down unless they read about it in the news. And even then the average middle-class citizen is more interested in how much money remains for her family to live on after the give and take of government taxes and transfers than whether or not the Gini index rose or fell by three-tenths of a point.

Could We Ask for More?

Several issues have so far been raised about the divergent approaches to the measurement of inequality, the disparate characteristics of those in different income brackets, the absence of cost-of-living adjustments, the plight of the middle class, the soaring 1 percent, and the sobering revelation of international comparisons. On the whole these issues enable us not so much to dismiss concerns about rising economic inequality as to calm public apprehensions about its rate, degree, and implications. The disparities related to the changing distribution of income in the United States look a lot more acute before taxes and benefits are taken into account, for example—are you listening, Dr. Piketty? As such it can be said that the capitalist market generates and the welfare state mitigates inequality.

Recounted in its most auspicious light, the story of this interaction over the past three decades reveals that while inequality increased, so did household incomes at every level. Measured by disposable household income the U.S. standard of living is among the highest of all the advanced industrial democracies, not to mention the rest of the world. Indeed, reflecting on the rest of the world, Tyler Cowen urges us to preface all discussions of inequality with a reminder that although economic inequality has been increasing in advanced industrialized nations, over the past two decades global inequality has been falling.16 And given global economic patterns, this is not a coincidence but a relationship.

Of course, in an ideal world everyone would have been even better off if the top 1 percent had taken home less than 13 percent of all the income and the bottom 20 percent had gained more—even while the economy grew at the same overall rate. Not to promote the best as an enemy of the good, there is nevertheless a convincing case to be made for social reforms that would to some degree shift the distribution of income away from the top. Progressives and conservatives generally agree on the need to rein in government transfers received by wealthy citizens, particularly the special benefits derived from the favorable tax treatment afforded to homeowners. These benefits, known as “tax expenditures,” allow home owners to deduct the interest paid on mortgages and to net up to $500,000 of capital gains tax-free on the sale of their homes.

The amounts are not trivial. The CBO estimates that the tax expenditures for mortgage-interest deductions amount to $70 billion, almost 73 percent of which goes to households in the top 20 percent of the income distribution, while those in bottom 20 percent receive no benefit. Although there would be some downside for the home-building industry, limiting tax subsidies to wealthy homeowners could lower the level of inequality without seriously adverse consequences for the rate of homeownership.

Yet even if these adjustments were made, much income inequality would still remain, which takes us back to the question: Could we ask for still more? Obviously, there are many ways for government to appropriate additional money from those in the upper-income brackets and deliver more to those on the bottom. Raising income taxes, lifting the ceiling on taxable income for Social Security, increasing the Earned Income Tax Credit and eliminating its marriage penalties, boosting the minimum wage, means-testing Social Security benefits, and taxing the fringe benefits of employment are among the evident alternatives. Then there are the less well-recognized but hardly trivial proposals to tax some classes of advertising and to eliminate the corporate income tax altogether in the context of comprehensive tax reform. Progressives and conservatives argue about whether any and all such measures would kill jobs or boost the economy, discourage work or stimulate activity, generate class conflict or enhance social solidarity, and advance social justice or deny the just deserts of individual merit. A vast literature on these issues has generated mixed findings about the implications of various measures.

Considering the uncertainty surrounding these issues, the degree of support for additional measures to spread the nation’s wealth is heavily influenced by one’s answer to the question: How serious is the problem of rising economic inequality amid abundance? The answer rests on competing ideas about the current state of material well-being in the United States, the integrity of free-market capitalism and, above all, the putative consequences of inequality.

Progressives tend to think that inequality is the story and that, as already noted, nearly everything wrong in U.S. society stems from it. But this argument ultimately depends on presumed maladies arising from inequality that more than stretch scientific criteria for medical causality. The evils ascribed to inequality expand roughly at the same rate as the DSM manual, and that is a suspicious thing.

As long as household incomes are increasing at every level (as measured by the CBO), conservatives are less concerned about rising economic inequality than progressives. They accept inequality as the tribute that equality of opportunity grants to merit, productivity, and luck in the free market, recognizing that this transaction is sometimes distorted by discrimination, exploitation, corruption, and outright larceny, which need to be checked by government. With the average family’s disposable household income in the United States among the highest in the world, inequality is perceived less as a source of social friction between the “haves and the have-nots” than as an imbalance between those who have a lot and others who have even more. This, on balance and seen in an historical perspective, ought to be a cause for celebration, not an occasion for mass self-flagellation.

1Vlastos, “Justice and Equality,” in Social Justice, edited by Richard Brandt (Prentice-Hall, 1962), p. 32.

2Frankfurt, On Inequality (Princeton University Press, 2015).

3“Real Personal Income for States and Metropolitan Areas, 2008-2012,” U.S. Bureau of Economic Analysis, April 24, 2014.

4Michael Forster et al., Society at a Glance 2011, (OECD 2011).

5“Partisan Polarization Surges in Bush, Obama Years: Trends in American Values: 1987-2012,” Pew Research Center, June 4, 2012.

6Piketty & Saez, “Income Inequality in the United States,” Quarterly Journal of Economics (February 2003).

7Burkhauser, “Presidential Address Evaluating the Questions that Alternative Policy Success Measures Answer,” Journal of Policy Analysis and Management (Spring 2011).

8Philip Armour, Richard V. Burkhauser, and Jeff Larrimore, “Deconstructing Income and Income Inequality Measures: A Crosswalk from Market Income to Comprehensive Income,” American Economic Review (May 2013). The government transfers included here involve both cash and in-kind benefits, specifically food stamps, housing subsidies, and school lunches, but not the value of employer- and government-provided health insurance. For an analysis of the income growth when cash transfers and health insurance are included, but not in-kind benefits, see Richard Burkhauser, Jeff Larrimore, and Kosali Simon, “A ‘Second Opinion’ on the Economic Health of the American Middle Class,” National Tax Journal (March 2012), pp. 7-32.

9Congressional Budget Office, The Distribution of Household Income and Federal Taxes, 2008 and 2009 (Government Printing Office, 2012). The major components of income included here differ from those recommended by the Canberra Group mainly in regard to capital gains, which the Canberra guidelines exclude from the measure of household income in favor of their treatment as changes in net worth.

10Congressional Budget Office, The Distribution of Household Income and Federal Taxes, 2010 (Government Printing Office, 2013).

11U.S. Treasury Department, Income Mobility in the U.S. from 1996 to 2005 (Government Printing Office, 2007). A similar rate of mobility was reported for those in the bottom quintile from 1986 to 1996. Unlike the CBO measure, these findings are based on pre-tax market income plus cash but not tax-exempt or in-kind transfers. Also, the unit of analysis is not adjusted for household size.

12Wilcox & Lerman, “For richer, for poorer: How Family Structures Economic Success in America,” AEI, October 28, 2014.

13The Distribution of Household Income and Federal Taxes, 2010. In 2010 the top 1 percent netted almost 13 percent of all the after tax income (15 percent before taxes).

14Peter Eavis, “Invasion of the Supersalaries,” New York Times, April 13, 2014.

15Dionne Searcey & Robert Gebeloffjan, “Middle Class Shrinks Further as More Fall Out Instead of Climbing Up,” New York Times, January 25, 2015. Rakesh Kochhar & Richard Fry, “America’s ‘Middle’ Holds Its Ground After the Great Recession,” Pew Research Center, February 4, 2015.

16Cowen, “Income Inequality Is Not Rising Globally. It’s Falling,” New York Times, July 19, 2014.

Neil Gilbert is Chernin Professor of Social Welfare at the University of California, Berkeley. This essay is adapted from his latest book, Never Enough: Capitalism and the Progressive Spirit (Oxford University Press, forthcoming
« Last Edit: January 09, 2017, 10:28:33 AM by DougMacG »

Crafty_Dog

  • Administrator
  • Power User
  • *****
  • Posts: 69383
    • View Profile
Re: Political Economics
« Reply #1675 on: January 05, 2017, 11:49:33 AM »
Please post that in the Economics thread as well.

Crafty_Dog

  • Administrator
  • Power User
  • *****
  • Posts: 69383
    • View Profile

objectivist1

  • Power User
  • ***
  • Posts: 1048
    • View Profile
"You have enemies?  Good.  That means that you have stood up for something, sometime in your life." - Winston Churchill.

DougMacG

  • Power User
  • ***
  • Posts: 18236
    • View Profile
Political Economics, gender pay equity
« Reply #1678 on: February 05, 2017, 10:00:21 PM »
Linking this post to this thread:
http://dogbrothers.com/phpBB2/index.php?topic=490.msg101481#msg101481
Audi Super Bowl ad

ccp

  • Power User
  • ***
  • Posts: 18501
    • View Profile
Re: Political Economics
« Reply #1679 on: February 06, 2017, 07:08:14 AM »
Women doctors do tend to pick fields with hours are more 9 to 5 I believe.   For many years they were far more likely to pick salaried jobs then go into an office on their own.  Though that trend has reversed for all doctors these days.

Perhaps they were paid less in groups of doctors or did not make partnership or perhaps in academia based on being female but other then that it HAS to be that they are working less hard, or less hours.

So when I see occasional stories that female doctors don't make as much and implying it is because they don't have a penis then I know it is it can't be true

Do these authors mean to tell me that women are singled out for lower payments from Medicare, Aetna, United Healthcare , Blue shield cross?

Crafty_Dog

  • Administrator
  • Power User
  • *****
  • Posts: 69383
    • View Profile

DougMacG

  • Power User
  • ***
  • Posts: 18236
    • View Profile
Re: Good summary of Obama years
« Reply #1681 on: March 16, 2017, 06:59:43 AM »
http://www.againstcronycapitalism.org/2017/01/obamas-final-jobs-report-is-a-fitting-end-to-his-presidency/

"Our view has consistently been that the economic recovery from the Great Recession could have been — and should have been — very robust. And that the only reason it wasn’t is growth-choking policies imposed by Obama: Dodd-Frank, ObamaCare, tax hikes, huge new regulatory burdens." - IBD

The crash and the Great Recession were also caused by Democrat policies - Democrat policies that Republicans agreed to.
« Last Edit: March 16, 2017, 07:02:46 AM by DougMacG »

DougMacG

  • Power User
  • ***
  • Posts: 18236
    • View Profile
Re: Political Economics, productivity stagnation equals economic stagnation
« Reply #1682 on: April 05, 2017, 06:46:42 AM »
Productivity growth is running at roughly one tenth of what it could be.

"From 2011 to 2015 productivity grew only 0.4 percent a year compared with 3.0 percent from 1996 to 2005."
https://economicsone.com/2017/03/01/economic-policy-explains-growth-conundrum/

Trump, with temporary Republican majorities in the House and Senate, is going to have his first economic year scored under the tax system and healthcare system of the far left.  Do the same thing.  Expect a different result. Insane. Or stupid.

The last crash was caused by Republicans signing on to Democrat policies. (cf. CRAp, Community Reinvestment Act - program).

Good luck everyone.

DougMacG

  • Power User
  • ***
  • Posts: 18236
    • View Profile
Political Economics: Government Makes the Poor Poorer
« Reply #1683 on: April 10, 2017, 10:40:13 AM »
A good article by Stephen Moore.  I could add quite a few more examples.  SSI is a contract with the government to stay poor.  So is Food Stamps, Section 8, FAFSA and Obamacare. We used to talk about the success of programs being measured by how many people no longer need assistance.  Now we just measure programs by how money they can transfer to how many people.

https://spectator.org/government-makes-the-poor-poorer/

For all the obsession in Washington and in college faculty lounges over income inequality, why isn’t there more outrage over government policies that exacerbate the problem? There are hundreds of programs that make the poor poorer and increase poverty in America. Many of them were exposed last week by my colleagues at the Heritage Foundation forum on this very topic.

Economist ‎Don Boudreaux of George Mason University unmasked two such policies. One is trade protectionism. Trade barriers raise prices and “act as a regressive tax” on Americans, Boudreaux explains. They also stunt the very innovation process that makes goods and services widely available to people at affordable prices to begin with. Think about who the consumers are that shop for those everyday low prices at Wal-Mart. It’s not Hillary Clinton.

Minimum wage clearly fits into this category as well. In every other industry, Boudreaux notes, when something is more expensive, we buy less of it. Why do some economists think that isn’t so when it comes to buying labor? Especially for the young and the lowest skilled, minimum wage becomes a toll that prevents many from entering the work force and gaining the skills that can make a low income or middle class worker a high income worker. This is so obvious that one wonders why liberals keep championing the minimum wage cause.

Marlo Lewis of the Competitive Enterprise Institute points out that the fuel economy standards promoted by the leftist environmentalists add thousands of dollars to the cost of a new car. He estimates that these “green” policies could mean that 5 million fewer Americans each year can’t afford a new car. And, again, those 5 million victims are surely not people like Al Gore or the board members of the Sierra Club.


Another green policy that hurts the poor is the anti-fracking crusade of the environmentalists. In my book with Kathleen Hartnett White, Fueling Freedom, we point out that the lower cost of electricity due to cheap shale natural gas has benefited low income households to the tune of well over $4 billion a year. This is four times the benefit of the low income home energy assistance program. So if liberals really care about the poor, why not get rid of LIHEAP and promote fracking instead?

Social Security is the greatest swindle of the poor ever. A new study by Peter Ferrara for the Committee to Unleash Prosperity shows that the average poor person who works 40 hours a week during his or her working life would retire with a larger monthly benefit and would have $1 million or more in an estate that could be left to a spouse or children at death if they could simply put their payroll tax dollars into a personal 401k retirement account and tap into the power of compound interest.

Under Social Security poor (and middle class) households leave next to nothing for their kids at death. So Social Security robs nearly every low and middle income family with a full time worker of at least $1 million over their lifetime. What a deal!

Occupational licensing laws — in trades like moving companies, realtors, hair dressers, limousine services, beauticians, physical therapy and on and on — ‎stunt small business start-ups, destroy jobs, and raise prices for lower income consumers. What about the right to make a living?

Big government advocates defend these statist occupational barriers to entry by arguing that they are needed to uphold professional service quality. Professor Boudreaux shows evidence that, to the contrary, licensing requirements reduce service quality by shrinking competition in the industry.

Arguably the program that has set back upward income mobility ‎for the poor the most is the government school system in inner cities. Every study finds abysmal educational outcomes and even unsafe environments for schoolchildren despite cities spending upward of $20,000 per child. In Catholic inner-city schools, these same kids could and should be receiving a better education at half the cost. Yet liberals who champion the poor oppose school choice programs that would raise educational achievement and future earnings. (Look at the disgraceful treatment of Trump’s education chief Betsy DeVos).

These examples merely scratch the surface of scores of governmental polices that are regressive. Could it be that the gridlock and polarization in Washington would be ended by a bipartisan reform movement to scout out and remove laws and rules that hurt those at the bottom of the income scale the most? One universal goal that we should all agree on and aspire to is equality of opportunity — which these laws squelch.

Where are Bernie Sanders and Elizabeth Warren and Nancy Pelosi and the class warfare warriors on reversing government policies that are stealing money and opportunities for low income and minority families? Do they care about protecting the poor? Or do they care more about protecting big government? It’s time to really find out.


DougMacG

  • Power User
  • ***
  • Posts: 18236
    • View Profile
Re: 1Q slower growth
« Reply #1685 on: April 28, 2017, 09:32:07 AM »
https://www.nytimes.com/2017/04/28/business/economy/economy-gross-domestic-product-first-quarter.html?emc=edit_na_20170428&nl=breaking-news&nlid=49641193&ref=cta&_r=0

"The economy barely grew, expanding at an annual rate of only 0.7 percent."

Let's see...  Keep Obamacare, the biggest tax and regulation takeover in history, in place.  Keep the Obama, Reid, Pelosi tax system fully in place.  Watch Democrat Fed Chair Yellen raise interest rates based on this 'robust recovery' she sees.  And see economic growth hit zero.

What's that?  Did I just hear Brian Wesbury say Doug was right?? 

G M

  • Power User
  • ***
  • Posts: 26643
    • View Profile
Re: 1Q slower growth
« Reply #1686 on: April 28, 2017, 09:54:14 AM »
The deep state may well be trying to bring the crash on Trump's watch.


https://www.nytimes.com/2017/04/28/business/economy/economy-gross-domestic-product-first-quarter.html?emc=edit_na_20170428&nl=breaking-news&nlid=49641193&ref=cta&_r=0

"The economy barely grew, expanding at an annual rate of only 0.7 percent."

Let's see...  Keep Obamacare, the biggest tax and regulation takeover in history, in place.  Keep the Obama, Reid, Pelosi tax system fully in place.  Watch Democrat Fed Chair Yellen raise interest rates based on this 'robust recovery' she sees.  And see economic growth hit zero.

What's that?  Did I just hear Brian Wesbury say Doug was right?? 

DougMacG

  • Power User
  • ***
  • Posts: 18236
    • View Profile
Re: 1Q slower growth
« Reply #1687 on: April 28, 2017, 10:03:01 AM »
"The deep state may well be trying to bring the crash on Trump's watch."

For sure, Yellen was not going to risk any damage on Obama's watch.

DougMacG

  • Power User
  • ***
  • Posts: 18236
    • View Profile
Political Economics, Make-or-Break Moment for America Over Economic Growth
« Reply #1688 on: May 02, 2017, 07:27:57 AM »
One writer gets it.  If we don't improve from a period of zero growth and doubling of the debt, what comes next?  More of the same?  I doubt it.  Could be MUCH worse if we don't straighten out stagnation and disincentives system.

http://www.nysun.com/national/make-or-break-moment-at-hand-for-america-over/89968/

Make-or-Break Moment At Hand for America Over Economic Growth.
Conrad Black, May 2 2017, NY Sun

GDP growth declined from 4.5% annually in the last six Reagan years, to 3.9% in the last six Clinton years (as the current-account deficit and the housing bubble ballooned), to 2% in the George W. Bush years, to 1% in the Obama years. If per capita GDP had increased in the first 15 years of this new century as it had in the years between 1945 and 2000, families and individuals in the United States would be 20 percent wealthier than they are. In the Reagan years, the federal debt increased to 50% of GDP from 40%. That debt declined a little in the Clinton years, but, in this century, even as a percentage of GDP, it has more than doubled.

These are extremely dangerous trends. The average American is aware of a 15-year flat-lined income in terms of buying power, and the absence of job security despite an official level of unemployment of a very acceptable 4.7%. Most would know, from their own experiences or acquaintances, that the labor force has shrunk, in fact by 15 million people.

There are now over 20 million Americans of prime employment age (25 to 54) who have dropped out and are sustained by the benefit system, especially Medicaid-supplied painkillers, food stamps, and activities that generally escape official compilation. Many of these are among the 750,000 people released each year by the bloated and corrupt prison system, which does all it can to demotivate, stigmatize, and render unemployable those released — and make more likely the return to its embrace. The system in any case always imprisons at least as many new convicts each year.

If the Trump administration does not get a tax bill through that rekindles economic expansion, the entire American project is going to face its greatest crisis since Roosevelt came in to grapple with the Great Depression.
...
President Trump has proposed tax changes — simplification, rate reductions, elimination of special exemptions, patriation of overseas corporate profits — that will induce a recovery and reverse 30 years of declining economic growth.

More at link: http://www.nysun.com/national/make-or-break-moment-at-hand-for-america-over/89968/

G M

  • Power User
  • ***
  • Posts: 26643
    • View Profile
We won't change anything until the actual collapse.


One writer gets it.  If we don't improve from a period of zero growth and doubling of the debt, what comes next?  More of the same?  I doubt it.  Could be MUCH worse if we don't straighten out stagnation and disincentives system.

http://www.nysun.com/national/make-or-break-moment-at-hand-for-america-over/89968/

Make-or-Break Moment At Hand for America Over Economic Growth.
Conrad Black, May 2 2017, NY Sun

GDP growth declined from 4.5% annually in the last six Reagan years, to 3.9% in the last six Clinton years (as the current-account deficit and the housing bubble ballooned), to 2% in the George W. Bush years, to 1% in the Obama years. If per capita GDP had increased in the first 15 years of this new century as it had in the years between 1945 and 2000, families and individuals in the United States would be 20 percent wealthier than they are. In the Reagan years, the federal debt increased to 50% of GDP from 40%. That debt declined a little in the Clinton years, but, in this century, even as a percentage of GDP, it has more than doubled.

These are extremely dangerous trends. The average American is aware of a 15-year flat-lined income in terms of buying power, and the absence of job security despite an official level of unemployment of a very acceptable 4.7%. Most would know, from their own experiences or acquaintances, that the labor force has shrunk, in fact by 15 million people.

There are now over 20 million Americans of prime employment age (25 to 54) who have dropped out and are sustained by the benefit system, especially Medicaid-supplied painkillers, food stamps, and activities that generally escape official compilation. Many of these are among the 750,000 people released each year by the bloated and corrupt prison system, which does all it can to demotivate, stigmatize, and render unemployable those released — and make more likely the return to its embrace. The system in any case always imprisons at least as many new convicts each year.

If the Trump administration does not get a tax bill through that rekindles economic expansion, the entire American project is going to face its greatest crisis since Roosevelt came in to grapple with the Great Depression.
...
President Trump has proposed tax changes — simplification, rate reductions, elimination of special exemptions, patriation of overseas corporate profits — that will induce a recovery and reverse 30 years of declining economic growth.

More at link: http://www.nysun.com/national/make-or-break-moment-at-hand-for-america-over/89968/


DougMacG

  • Power User
  • ***
  • Posts: 18236
    • View Profile
Re: Political Economics
« Reply #1690 on: May 03, 2017, 01:14:04 PM »
"We won't change anything until the actual collapse."

If the collapse happens under the appearance of Republican governance, the change will not be for the better.  (cf. 2008.)

G M

  • Power User
  • ***
  • Posts: 26643
    • View Profile
The debt-bubble landmine Obama left for Trump
« Reply #1691 on: May 08, 2017, 02:10:35 PM »
http://nypost.com/2017/05/07/the-debt-bubble-landmine-obama-left-for-trump/

The debt-bubble landmine Obama left for Trump
By Nicole Gelinas May 7, 2017 | 7:06pm
Modal Trigger The debt-bubble landmine Obama left for Trump

President Trump came in for much jeering when he told reporters he had “inherited a mess” from President Barack Obama. On the economy, though, Obama did indeed leave behind a hidden mess: a seemingly healthy jobs market dependent on cheap debt.

When this debt bubble bursts, just as the last one did, the manufacturing jobs Trump wants to save will be in even greater peril.

The country’s last bubble was in housing. Between 2000 and 2007, Americans nearly doubled their mortgage debt, from $5.9 trillion to $10.6 trillion.

This didn’t bother anyone in a position of power. The housing boom created millions of jobs, from construction to home-furnishing, and people felt rich.

What bothered the pols was when the illusion broke.

Since the 2008 crash, neither Democrats nor Republicans have been interested in creating a sturdier economy. Instead, they’ve built up another bubble, this time in the car and SUV industry.

How? The same way: cheap debt. In 2010, Americans owed $809 billion on their cars (after adjusting for inflation). Today, they owe nearly $1.2 trillion, according to the New York Fed.

And the rate of growth has been accelerating: Last year alone, Americans borrowed $93 billion to buy cars (after accounting for people who repaid such debt); 2016 was “the highest auto loan . . . year in the 18-year history of the data,” Fed researchers said, not entirely enthusiastically.

People with great credit have been buying new SUVs because interest rates have been at record lows. As interest rates rise, they’ll pull back, but perhaps not that much. By definition, they can afford to pay a little more.

But who is borrowing for used cars — and at much higher interest rates — is a huge concern.

People with not-great credit scores have always made up about a fifth of the auto-loan market.

But the percentage of people borrowing even though they have really bad credit scores has surged, reports Bloomberg. It’s now a third of the subprime auto-bond market, up from just 5 percent seven years ago.

A Standard & Poor’s analysis of just one big subprime auto bond tells the story. Last week, a company called DriveTime, which sells used cars in 26 states to people with bad credit, was in the market to issue $442 million worth of bonds backed by auto loans.

The average credit score of borrowers was 538 — indicating a history of serious default. And, as S&P notes, “today’s subprime customer appears to be . . . weaker . . . than that of several years ago,” because people who defaulted right after the housing crash at least had the excuse that they were caught up in a global bubble.

These loans are for people who have no choice but to borrow to buy a car, and no bargaining power on the interest rate they pay: close to 20 percent.

Even though the borrowers pay through the nose, they depend on cheap global credit. With interest rates still near record lows, lenders have to take ever more risk in a low-interest-rate environment to make a little money. As for that risk: Delinquency rates are rising, with 4.32 percent of subprime borrowers in general at least 60 days late last year, up from 3.52 two years earlier, says S&P.

The bigger risk here isn’t the risk to investors, though. The auto-loan market is still much smaller than the housing market, and the investment world hasn’t created trillions of dollars of derivative securities based on this market (at least not that we know of). And unlike with houses, no one ever expects the value of a car to increase with use.

No, this bubble presents a much more direct risk to the economy — and manufacturing jobs. If people with terrible credit can’t borrow an average of nearly $18,000 to buy a used car (what the DriveTime customer pays), the market for used cars collapses.

That, in turn, affects the market for new cars. Indeed, the US auto industry has seen sales decline this year, after clocking half a decade of record highs.

That’s bad news for the 946,300 Americans who work in the nation’s auto-manufacturing industry. Car-makers have been adding jobs since 2009, when the industry hit a low of 653,300 workers. But over the past year, they’ve added only 2,400 workers, down from the 40,300 people they added the previous year.

If the auto-credit market sputters out during Trump’s first term — and it’s hard to see how it won’t — Trump would be justified in blaming his predecessor.

But he’ll face the same bad options previous presidents have. No one has quite figured out how to fix this economy without a lot of short-term pain.

Nicole Gelinas is a contributing editor to the Manhattan Institute’s City Journal.

Crafty_Dog

  • Administrator
  • Power User
  • *****
  • Posts: 69383
    • View Profile
Skilled Trades Jobs
« Reply #1692 on: May 19, 2017, 07:09:32 AM »
Rep. Tom Suozzi’s “When the Welders Came to Capitol Hill” (op-ed, May 15) further confirms what we have seen for years in the trades—a mismatch of skills and changing demographics. The apprenticeship model is only one piece of the puzzle. Vocational schools must recruit in middle and high schools, as their university counterparts do, with an emphasis on personal success stories. If students see a poster of welders who sat in their same classroom three or four years earlier, who now make an upper-middle-class wage, they will become interested. Technical schools also must invest in high-school partnerships and classroom equipment donations.

Why aren’t we selling top-performing high schools on the economic opportunities the trades offer? Unions have an important role to play, but they must modernize their marketing practices and recruiting techniques—de-emphasize politics that divide and focus on the incredible projects that union labor builds and maintains. It would also help if more credit was given to technical education toward a multiyear apprenticeship. National certification standards are fine, but it has been our experience that a single publisher cannot provide all the answers for a curriculum.

Will we rise to the challenge and start producing the talent needed for a 21st-century labor market? It may well be the difference between growth and stagnation.

Ryan Blythe

Georgia Trade School

New jobs are created in the private sector by employers, not politicians. The welders would have enjoyed more success in their quest had they spoken with employers.

Robert Allan Schwartz

Lexington, Mass.

I reflect on the hundreds and perhaps thousands of welding jobs created in Pennsylvania by fracking for natural gas and the pipelines required for its transportation. It is a shame New York state doesn’t tap into this middle-class job creator. Then maybe the state could stop its multiyear national television ad campaign about how business is booming.

Rae Burton

Upper St. Clair, Pa.

Ben Franklin said it best, “He who hath a trade, hath an estate.”

Bob O’Con

Tarpon Springs, Fla.

G M

  • Power User
  • ***
  • Posts: 26643
    • View Profile
Unexpectedly!
« Reply #1693 on: June 17, 2017, 09:54:30 AM »
http://www.fresnobee.com/opinion/opn-columns-blogs/article155979969.html

Restaurant die-off is first course of California’s $15 minimum wage
BY JEREMY BAGOTT

In a pair of affluent coastal California counties, the canary in the mineshaft has gotten splayed, spatchcocked and plated over a bed of unintended consequences, garnished with sprigs of locally sourced economic distortion and non-GMO, “What the heck were they thinking?”

The result of one early experiment in a citywide $15 minimum wage is an ominous sign for the state’s poorer inland counties as the statewide wage floor creeps toward the mark.

Consider San Francisco, an early adopter of the $15 wage. It’s now experiencing a restaurant die-off, minting jobless hash-slingers, cashiers, busboys, scullery engineers and line cooks as they get pink-slipped in increasing numbers. And the wage there hasn’t yet hit $15.

ADVERTISING

As the East Bay Times reported in January, at least 60 restaurants around the Bay Area had closed since September alone.

A recent study by Michael Luca at Harvard Business School and Dara Lee Luca at Mathematica Policy Research found that every $1 hike in the minimum wage brings a 14 percent increase in the likelihood of a 3.5-star restaurant on Yelp! closing.

Another telltale is San Diego, where voters approved increasing the city’s minimum wage to $11.50 per hour from $10.50, this after the minimum wage was increased from $8 an hour in 2015 – meaning hourly costs have risen 43 percent in two years.

The cost increases have pushed San Diego restaurants to the brink, Stephen Zolezzi, president of the Food and Beverage Association of San Diego County, told the San Diego Business Journal. Watch for the next mass die-off there.

But what of California’s less affluent inland counties? How will they fare?

Christopher Thornberg, director of UC Riverside’s Center for Economic Forecasting and Development, told the San Bernardino Sun that politicians should have adopted a regional approach. He said it would been better to adapt minimum-wage levels to varying economies – something like the Oregon model, the nation’s first multi-tiered minimum-wage strategy.

Oregon’s minimum-wage law is phased, with increases over six years. By 2022, the minimum will be $14.75 an hour in Portland, $13.50 in midsize counties and $12.50 in rural areas.

“That makes sense,” Thornberg told the Sun. “That’s logical.”

California is even more varied economically than Oregon. Thornberg believes hiking wages in blanket fashion will spark layoffs and edge low-skilled workers out of the job market.

In the Central Valley, wages for all workers, on average, are lower than those of the coastal counties.

U.S. Census Bureau data show about 21 percent of workers in Bakersfield earned from $8 to $12 per hour in 2015, the most recent year for which data was available. In Fresno, 32 percent of workers were in that wage group, and in Modesto about 25 percent. Contrast that with Santa Clara County, home of Silicon Valley, which registered only 12.5 percent at that level.

The state’s diverse unemployment rates tell a similar tale. Unemployment in Bakersfield was 9.5 percent; 8.8 percent in Fresno, and Stanislaus County notched 7.9 percent. Compare that to Silicon Valley’s unemployment rate – 3.2 percent

“Part of our whole concern with (the $15 wage) is it’s a one-size-fits-all,” Rob Lapsley, president of the California Business Roundtable, told The Sacramento Bee last year. “Areas with double-digit unemployment, this is scaring them to death.”

Jamil Dada, chairman of the Riverside County Workforce Development Board, told the Sun that he believed the state’s Inland Empire will be hit harder than other parts of the state.

“It might be tolerable in the coastal regions,” he said. “Their business environment is completely different.”

As politicians insert their sausage fingers into subtle market mechanisms, scarcity and unintended consequences will ensue.

Joining San Francisco’s restaurant die-off was rising star AQ, which in 2012 was named a James Beard Award finalist for the best new restaurant in America. The restaurant’s profit margins went from a reported 8.5 percent in 2012 to 1.5 percent by 2015. Most restaurants are thought to require margins of 3 and 5 percent.

If what’s happening with one early adopter of the $15 wage progression is any indication, locally famous inland hash houses and burger joints from Calexico to the Cow Counties will disappear as mandated wages climb to $15 statewide. And that will only be the start of things.

Jeremy Bagott, a former journalist, writes about California finance and land-use issues. He wrote this for The Modesto Bee.

DougMacG

  • Power User
  • ***
  • Posts: 18236
    • View Profile
Re: Unexpectedly! Restaurant and restaurant jobs "DIE OFF"
« Reply #1694 on: June 17, 2017, 04:42:05 PM »
http://www.fresnobee.com/opinion/opn-columns-blogs/article155979969.html

Restaurant die-off is first course of California’s $15 minimum wage
BY JEREMY BAGOTT

In a pair of affluent coastal California counties, the canary in the mineshaft has gotten splayed, spatchcocked and plated over a bed of unintended consequences, garnished with sprigs of locally sourced economic distortion and non-GMO, “What the heck were they thinking?”

The result of one early experiment in a citywide $15 minimum wage is an ominous sign for the state’s poorer inland counties as the statewide wage floor creeps toward the mark.

Consider San Francisco, an early adopter of the $15 wage. It’s now experiencing a restaurant die-off, minting jobless hash-slingers, cashiers, busboys, scullery engineers and line cooks as they get pink-slipped in increasing numbers. And the wage there hasn’t yet hit $15.

ADVERTISING

As the East Bay Times reported in January, at least 60 restaurants around the Bay Area had closed since September alone.

A recent study by Michael Luca at Harvard Business School and Dara Lee Luca at Mathematica Policy Research found that every $1 hike in the minimum wage brings a 14 percent increase in the likelihood of a 3.5-star restaurant on Yelp! closing.

Another telltale is San Diego, where voters approved increasing the city’s minimum wage to $11.50 per hour from $10.50, this after the minimum wage was increased from $8 an hour in 2015 – meaning hourly costs have risen 43 percent in two years.

The cost increases have pushed San Diego restaurants to the brink, Stephen Zolezzi, president of the Food and Beverage Association of San Diego County, told the San Diego Business Journal. Watch for the next mass die-off there.

But what of California’s less affluent inland counties? How will they fare?

Christopher Thornberg, director of UC Riverside’s Center for Economic Forecasting and Development, told the San Bernardino Sun that politicians should have adopted a regional approach. He said it would been better to adapt minimum-wage levels to varying economies – something like the Oregon model, the nation’s first multi-tiered minimum-wage strategy.

Oregon’s minimum-wage law is phased, with increases over six years. By 2022, the minimum will be $14.75 an hour in Portland, $13.50 in midsize counties and $12.50 in rural areas.

“That makes sense,” Thornberg told the Sun. “That’s logical.”

California is even more varied economically than Oregon. Thornberg believes hiking wages in blanket fashion will spark layoffs and edge low-skilled workers out of the job market.

In the Central Valley, wages for all workers, on average, are lower than those of the coastal counties.

U.S. Census Bureau data show about 21 percent of workers in Bakersfield earned from $8 to $12 per hour in 2015, the most recent year for which data was available. In Fresno, 32 percent of workers were in that wage group, and in Modesto about 25 percent. Contrast that with Santa Clara County, home of Silicon Valley, which registered only 12.5 percent at that level.

The state’s diverse unemployment rates tell a similar tale. Unemployment in Bakersfield was 9.5 percent; 8.8 percent in Fresno, and Stanislaus County notched 7.9 percent. Compare that to Silicon Valley’s unemployment rate – 3.2 percent

“Part of our whole concern with (the $15 wage) is it’s a one-size-fits-all,” Rob Lapsley, president of the California Business Roundtable, told The Sacramento Bee last year. “Areas with double-digit unemployment, this is scaring them to death.”

Jamil Dada, chairman of the Riverside County Workforce Development Board, told the Sun that he believed the state’s Inland Empire will be hit harder than other parts of the state.

“It might be tolerable in the coastal regions,” he said. “Their business environment is completely different.”

As politicians insert their sausage fingers into subtle market mechanisms, scarcity and unintended consequences will ensue.

Joining San Francisco’s restaurant die-off was rising star AQ, which in 2012 was named a James Beard Award finalist for the best new restaurant in America. The restaurant’s profit margins went from a reported 8.5 percent in 2012 to 1.5 percent by 2015. Most restaurants are thought to require margins of 3 and 5 percent.

If what’s happening with one early adopter of the $15 wage progression is any indication, locally famous inland hash houses and burger joints from Calexico to the Cow Counties will disappear as mandated wages climb to $15 statewide. And that will only be the start of things.

Jeremy Bagott, a former journalist, writes about California finance and land-use issues. He wrote this for The Modesto Bee.

“Economically, minimum wages may not make sense,” the governor said. “But morally and socially and politically they make every sense"
  - Gov. Jerry Brown
apnews.com/98cddb672d82427cb910b98c77fd1c4a

It makes moral, social and political sense to do the wrong thing economically and hurt businesses and workers?

Meanwhile, Bernie Sanders can't figure out why Democrats are losing elections outside of Vermont and California.

G M

  • Power User
  • ***
  • Posts: 26643
    • View Profile
Re: Unexpectedly! Restaurant and restaurant jobs "DIE OFF"
« Reply #1695 on: June 17, 2017, 04:48:04 PM »
http://www.fresnobee.com/opinion/opn-columns-blogs/article155979969.html

Restaurant die-off is first course of California’s $15 minimum wage
BY JEREMY BAGOTT

In a pair of affluent coastal California counties, the canary in the mineshaft has gotten splayed, spatchcocked and plated over a bed of unintended consequences, garnished with sprigs of locally sourced economic distortion and non-GMO, “What the heck were they thinking?”

The result of one early experiment in a citywide $15 minimum wage is an ominous sign for the state’s poorer inland counties as the statewide wage floor creeps toward the mark.

Consider San Francisco, an early adopter of the $15 wage. It’s now experiencing a restaurant die-off, minting jobless hash-slingers, cashiers, busboys, scullery engineers and line cooks as they get pink-slipped in increasing numbers. And the wage there hasn’t yet hit $15.

ADVERTISING

As the East Bay Times reported in January, at least 60 restaurants around the Bay Area had closed since September alone.

A recent study by Michael Luca at Harvard Business School and Dara Lee Luca at Mathematica Policy Research found that every $1 hike in the minimum wage brings a 14 percent increase in the likelihood of a 3.5-star restaurant on Yelp! closing.

Another telltale is San Diego, where voters approved increasing the city’s minimum wage to $11.50 per hour from $10.50, this after the minimum wage was increased from $8 an hour in 2015 – meaning hourly costs have risen 43 percent in two years.

The cost increases have pushed San Diego restaurants to the brink, Stephen Zolezzi, president of the Food and Beverage Association of San Diego County, told the San Diego Business Journal. Watch for the next mass die-off there.

But what of California’s less affluent inland counties? How will they fare?

Christopher Thornberg, director of UC Riverside’s Center for Economic Forecasting and Development, told the San Bernardino Sun that politicians should have adopted a regional approach. He said it would been better to adapt minimum-wage levels to varying economies – something like the Oregon model, the nation’s first multi-tiered minimum-wage strategy.

Oregon’s minimum-wage law is phased, with increases over six years. By 2022, the minimum will be $14.75 an hour in Portland, $13.50 in midsize counties and $12.50 in rural areas.

“That makes sense,” Thornberg told the Sun. “That’s logical.”

California is even more varied economically than Oregon. Thornberg believes hiking wages in blanket fashion will spark layoffs and edge low-skilled workers out of the job market.

In the Central Valley, wages for all workers, on average, are lower than those of the coastal counties.

U.S. Census Bureau data show about 21 percent of workers in Bakersfield earned from $8 to $12 per hour in 2015, the most recent year for which data was available. In Fresno, 32 percent of workers were in that wage group, and in Modesto about 25 percent. Contrast that with Santa Clara County, home of Silicon Valley, which registered only 12.5 percent at that level.

The state’s diverse unemployment rates tell a similar tale. Unemployment in Bakersfield was 9.5 percent; 8.8 percent in Fresno, and Stanislaus County notched 7.9 percent. Compare that to Silicon Valley’s unemployment rate – 3.2 percent

“Part of our whole concern with (the $15 wage) is it’s a one-size-fits-all,” Rob Lapsley, president of the California Business Roundtable, told The Sacramento Bee last year. “Areas with double-digit unemployment, this is scaring them to death.”

Jamil Dada, chairman of the Riverside County Workforce Development Board, told the Sun that he believed the state’s Inland Empire will be hit harder than other parts of the state.

“It might be tolerable in the coastal regions,” he said. “Their business environment is completely different.”

As politicians insert their sausage fingers into subtle market mechanisms, scarcity and unintended consequences will ensue.

Joining San Francisco’s restaurant die-off was rising star AQ, which in 2012 was named a James Beard Award finalist for the best new restaurant in America. The restaurant’s profit margins went from a reported 8.5 percent in 2012 to 1.5 percent by 2015. Most restaurants are thought to require margins of 3 and 5 percent.

If what’s happening with one early adopter of the $15 wage progression is any indication, locally famous inland hash houses and burger joints from Calexico to the Cow Counties will disappear as mandated wages climb to $15 statewide. And that will only be the start of things.

Jeremy Bagott, a former journalist, writes about California finance and land-use issues. He wrote this for The Modesto Bee.

“Economically, minimum wages may not make sense,” the governor said. “But morally and socially and politically they make every sense"
  - Gov. Jerry Brown
apnews.com/98cddb672d82427cb910b98c77fd1c4a

It makes moral, social and political sense to do the wrong thing economically and hurt businesses and workers?

Meanwhile, Bernie Sanders can't figure out why Democrats are losing elections outside of Vermont and California.

That's ok. The left will just shoot the legislators they don't like.


DougMacG

  • Power User
  • ***
  • Posts: 18236
    • View Profile
Re: Political Economics - The Deniers of Science
« Reply #1697 on: July 13, 2017, 08:17:39 AM »
This is Reason magazine, link below, it's good to see famous people caught reading the forum.  In a more honest way than the climate alarmists do, I have been trying to start the drumbeat that anyone who doesn't agree that incentives and disincentives matter in economics is a denier of science. 

http://dogbrothers.com/phpBB2/index.php?topic=1467.msg99884#msg99884
http://dogbrothers.com/phpBB2/index.php?topic=1791.msg104968#msg104968
http://dogbrothers.com/phpBB2/index.php?topic=2550.msg104435#msg104435

Minimum wage law is a most obvious violator of the laws of supply and demand taught generally in chapter one of any beginning economics textbook.  Raising minimum wage laws, which means prohibiting the hiring of people worth a smaller amount, blocks thousands or millions of people from stepping up onto the first rung of the economic employment ladder.  It hurts them instantly and the damage can last a lifetime.

http://reason.com/archives/2017/07/12/is-it-time-to-start-dismissing-economics
Is It Time to Start Dismissing 'Economics Deniers'?
Minimum wage laws have negative effects whether or not their advocates acknowledge them.
---------------------------------------

Exhibit B of science denial:  Capital employs labor.  Capital makes labor more productive.  Think digging with your hands, digging with a shovel and wheelbarrow or moving dirt with a 2000hp diesel Caterpillar.   

Mike Mulvaney (Director OMB) explains MAGAnomics (Make America Great Again-nomics)
The difference between 2% growth and 3% growth since WWII is median income of 50k versus 26k.  Step one is:  "Tax reform. We need to boost productivity. Fundamental to that is encouraging capital investment."
https://www.wsj.com/articles/introducing-maganomics-1499899298

The entire left and media (I repeat myself) call that policy "tax cuts for the rich" because the rich by definition have more capital.  But to deny that we live in an interconnected economy and deny that labor, productivity and wage and income growth up and down the economy is tied to capital performance is to deny science.

We tried the opposite policies.  We raised taxes on capital and we put more and more regulations on employers and the result was stagnant wages for the middle class.  We stomped out economic growth, yet 'income inequality' continued to widen anyway.  Who knew?

A growing economy benefits all who participate in it.  Some participate in it more than others.  That is not good reason to oppose economic growth.  More people participate in a healthy economy than a sick one.  Incomes across the board can only rise in a growing economy.  The economy doesn't grow when you handcuff or confiscate capital.  See Venezuela - or Obamanomics.

A drying-up economy grounds all ships.

Stop playing defense on economics and start calling out these deniers out for their ignorance and duplicity.  MHO   )

DougMacG

  • Power User
  • ***
  • Posts: 18236
    • View Profile
Re: Political Economics - Iowahawk on Minimum Wage
« Reply #1698 on: July 13, 2017, 08:25:42 AM »
"everybody, get out a Sharpie and let's draw an extra zero on all our money to save the economy"
http://twitchy.com/sd-3133/2017/07/03/hitting-the-crack-pipe-matt-yglesias-achieves-peak-dumbassery-with-this-take-on-minimum-wage/

DougMacG

  • Power User
  • ***
  • Posts: 18236
    • View Profile
Re: Political Economics, Minimum Wage Disaster, new study August 2017
« Reply #1699 on: August 18, 2017, 04:10:15 PM »
http://papers.nber.org/tmp/62829-w23667.pdf

ABSTRACT
We study the effect of minimum wage increases on employment in automatable jobs – jobs in
which employers may find it easier to substitute machines for people – focusing on low-skilled
workers from whom such substitution may be spurred by minimum wage increases. Based on
CPS data from 1980-2015, we find that increasing the minimum wage decreases significantly the
share of automatable employment held by low-skilled workers, and increases the likelihood that
low-skilled workers in automatable jobs become unemployed. The average effects mask
significant heterogeneity by industry and demographic group, including substantive adverse
effects for older, low-skilled workers in manufacturing. The findings imply that groups often
ignored in the minimum wage literature are in fact quite vulnerable to employment changes and
job loss because of automation following a minimum wage increase.

Grace Lordan
Department of Social Policy
London School of Economics

David Neumark
Department of Economics
University of California at Irvine

Ms. Lordan and Mr. Neumark show that mandating higher wages kills jobs for low-skill workers across a range of industries. According to the authors, older workers in manufacturing are hit particularly hard, with women and African-American workers also suffering disproportionate harm:

Overall, we find that increasing the minimum wage decreases significantly the share of automatable employment held by low-skilled workers. Our estimates suggest that an increase of the minimum wage by $1 (based on 2015 dollars) decreases the share of low-skilled automatable jobs by 0.43 percentage point... In particular, there are large effects on the shares of automatable employment in manufacturing, where we estimate that a $1 increase in the minimum wage decreases the share of automatable employment among low-skilled workers by 0.99 percentage point... Within manufacturing, the share of older workers in automatable employment declines most sharply, and the share of workers in automatable employment also declines sharply for women and blacks.

Our analysis at the individual level draws many similar conclusions. We find that a significant number of individuals who were previously in automatable employment are unemployed in the period following a minimum wage increase.
---

The authors also warn that the universe of jobs that can be done by machines is expanding, and will likely soon include such occupations as taxi drivers and bricklayers. This means that minimum wage laws could do more damage in the future than they have in the past.

According to the Democrats’ new “Better Deal” economic agenda, “increasing the minimum wage will provide economic security for all working Americans.” But it’s hard for Americans to have economic security if they’re not working.

https://www.wsj.com/articles/a-brief-history-of-minimum-wage-disasters-1502823330
-------

What's that again?  This is the National Bureau of Economic Research, not a right wing blog.  Which side favors policies that hurt older workers, women and African Americans disproportionately?  Why don't they disclose all of that before they poll who favors it and who opposes the policy!